136957005185204000001729750--12-312021FYNASDAQNASDAQ14253948117561090.751.85P5YP3YP4Y6Mfalse0001729750srt:MinimumMemberus-gaap:MeasurementInputRiskFreeInterestRateMemberus-gaap:WarrantMember2020-12-310001729750srt:MinimumMemberus-gaap:MeasurementInputOptionVolatilityMemberus-gaap:WarrantMember2020-12-310001729750srt:MinimumMemberus-gaap:MeasurementInputExpectedTermMemberus-gaap:WarrantMember2020-12-310001729750srt:MaximumMemberus-gaap:MeasurementInputRiskFreeInterestRateMemberus-gaap:WarrantMember2020-12-310001729750srt:MaximumMemberus-gaap:MeasurementInputOptionVolatilityMemberus-gaap:WarrantMember2020-12-310001729750srt:MaximumMemberus-gaap:MeasurementInputExpectedTermMemberus-gaap:WarrantMember2020-12-310001729750us-gaap:MeasurementInputExpectedDividendRateMemberus-gaap:WarrantMember2020-12-310001729750kbnt:EmployeesMemberkbnt:Plan2017Memberus-gaap:ShareBasedCompensationAwardTrancheTwoMember2021-04-012021-06-300001729750kbnt:TwoThousandSeventeenEquityIncentivePlanMember2020-01-012020-12-310001729750srt:BoardOfDirectorsChairmanMember2021-10-012021-12-310001729750kbnt:ServiceProvidersMemberkbnt:Plan2017Member2021-01-012021-03-310001729750kbnt:Plan2017Member2021-01-012021-03-310001729750kbnt:ServiceProvidersMemberkbnt:Plan2017Member2020-01-012020-12-310001729750us-gaap:RetainedEarningsMember2021-12-310001729750us-gaap:AdditionalPaidInCapitalMember2021-12-310001729750us-gaap:RetainedEarningsMember2020-12-310001729750us-gaap:AdditionalPaidInCapitalMember2020-12-310001729750us-gaap:RetainedEarningsMember2019-12-310001729750us-gaap:AdditionalPaidInCapitalMember2019-12-310001729750us-gaap:CommonStockMember2021-12-310001729750us-gaap:CommonStockMember2020-12-310001729750us-gaap:CommonStockMember2019-12-310001729750kbnt:TwoThousandSeventeenEquityIncentivePlanMember2021-11-090001729750us-gaap:OverAllotmentOptionMember2020-12-280001729750us-gaap:EmployeeStockOptionMemberkbnt:ExercisePriceRangeTwoMember2021-12-310001729750us-gaap:EmployeeStockOptionMemberkbnt:ExercisePriceRangeThreeMember2021-12-310001729750us-gaap:EmployeeStockOptionMemberkbnt:ExercisePriceRangeOneMember2021-12-310001729750us-gaap:EmployeeStockOptionMemberkbnt:ExercisePriceRangeFourMember2021-12-310001729750us-gaap:EmployeeStockOptionMemberkbnt:ExercisePriceRangeTwoMember2021-01-012021-12-310001729750us-gaap:EmployeeStockOptionMemberkbnt:ExercisePriceRangeThreeMember2021-01-012021-12-310001729750us-gaap:EmployeeStockOptionMemberkbnt:ExercisePriceRangeOneMember2021-01-012021-12-310001729750us-gaap:EmployeeStockOptionMemberkbnt:ExercisePriceRangeFourMember2021-01-012021-12-310001729750us-gaap:EmployeeStockOptionMember2020-12-310001729750us-gaap:EmployeeStockOptionMember2021-01-012021-12-310001729750us-gaap:EmployeeStockOptionMember2021-12-310001729750us-gaap:EmployeeStockOptionMember2020-01-012020-12-310001729750us-gaap:PerformanceSharesMemberkbnt:Plan2021Memberus-gaap:SubsequentEventMember2022-01-012022-01-010001729750kbnt:ChiefProductOfficerMemberus-gaap:ShareBasedCompensationAwardTrancheThreeMember2021-04-092021-04-090001729750kbnt:ChiefProductOfficerMemberkbnt:ShareBasedPaymentArrangementTrancheFourMember2021-04-092021-04-090001729750us-gaap:RestrictedStockUnitsRSUMemberkbnt:Plan2021Memberus-gaap:SubsequentEventMember2022-01-012022-01-010001729750kbnt:EmployeesMemberkbnt:Plan2017Memberus-gaap:ShareBasedCompensationAwardTrancheOneMember2021-04-012021-06-300001729750kbnt:GrantUnderEconomicInjuryDisasterLoanCaresActMember2021-12-3100017297502022-01-012021-12-310001729750us-gaap:ConvertibleNotesPayableMember2021-01-012021-12-310001729750us-gaap:ConvertibleNotesPayableMember2020-01-012020-12-310001729750kbnt:NotesPayableRelatedPartiesMember2020-01-012020-12-310001729750kbnt:PaycheckProtectionProgramLoanCaresActMember2020-04-062020-04-060001729750us-gaap:OverAllotmentOptionMember2020-08-142020-08-140001729750kbnt:MediacrossingIncMember2021-11-012021-11-300001729750srt:ChiefFinancialOfficerMemberkbnt:Plan2021Memberus-gaap:SubsequentEventMember2022-01-012022-01-010001729750kbnt:MediacrossingIncMember2021-12-012021-12-310001729750us-gaap:RetainedEarningsMember2021-01-012021-12-310001729750us-gaap:RetainedEarningsMember2020-01-012020-12-310001729750kbnt:EngageBdrLlcMember2018-11-142018-11-140001729750kbnt:EngageBdrLlcMemberkbnt:SettlementAgreementsMember2021-02-192021-02-190001729750kbnt:AdvisioSolutionsLlcMemberus-gaap:CustomerListsMember2021-06-040001729750kbnt:AureusHoldingsLlcDBLo70sMemberus-gaap:SettledLitigationMember2021-01-012021-12-310001729750kbnt:MediacrossingIncMemberkbnt:RestrictiveCovenantAgreementsMember2021-11-302021-11-300001729750kbnt:MediacrossingIncMemberkbnt:CustomerContractsAndRelatedCustomerRelationshipsMember2021-11-302021-11-300001729750kbnt:AdvisioSolutionsLlcMemberus-gaap:CustomerListsMember2021-06-042021-06-040001729750us-gaap:ComputerSoftwareIntangibleAssetMember2021-01-012021-12-310001729750kbnt:CapitalizedSoftwareMember2021-01-012021-12-310001729750us-gaap:CustomerListsMember2019-12-310001729750kbnt:RestrictiveCovenantAgreementsMember2019-12-310001729750kbnt:AcquiredDataMember2019-12-310001729750us-gaap:CustomerListsMember2021-12-310001729750kbnt:RestrictiveCovenantAgreementsMember2021-12-310001729750kbnt:AcquiredSoftwareMember2021-12-310001729750kbnt:AcquiredDataMember2021-12-310001729750kbnt:AccumulatedAmortizationMember2021-12-310001729750kbnt:AcquiredSoftwareMember2020-12-310001729750kbnt:AcquiredDataMember2020-12-310001729750kbnt:AccumulatedAmortizationMember2020-12-310001729750kbnt:AcquiredSoftwareMember2019-12-310001729750kbnt:AccumulatedAmortizationMember2019-12-310001729750kbnt:NotesPayableRelatedPartiesMember2021-01-012021-12-310001729750kbnt:EconomicInjuryDisasterLoanCaresActMember2020-06-232020-06-230001729750srt:MinimumMemberkbnt:NotesPayableRelatedPartiesMember2021-12-310001729750srt:MaximumMemberkbnt:NotesPayableRelatedPartiesMember2021-12-310001729750srt:ChiefExecutiveOfficerMember2020-07-280001729750kbnt:PaycheckProtectionProgramLoanCaresActMember2020-04-060001729750kbnt:EconomicInjuryDisasterLoanCaresActMember2020-06-230001729750us-gaap:WarrantMember2020-08-142020-08-140001729750us-gaap:ConvertibleNotesPayableMember2020-08-142020-08-140001729750kbnt:HoldersOfNotesPayableMember2020-08-142020-08-140001729750us-gaap:ConvertibleNotesPayableMember2020-08-122020-08-120001729750us-gaap:CostOfGoodsProductLineMemberus-gaap:SupplierConcentrationRiskMemberkbnt:TopFourSuppliersMember2021-01-012021-12-310001729750us-gaap:CostOfGoodsProductLineMemberus-gaap:SupplierConcentrationRiskMemberkbnt:SupplierEMember2021-01-012021-12-310001729750kbnt:TopThreeCustomersMemberus-gaap:AccountsReceivableMemberus-gaap:CustomerConcentrationRiskMember2021-01-012021-12-310001729750kbnt:TopFiveCustomersMemberus-gaap:RevenueFromContractWithCustomerMemberus-gaap:CustomerConcentrationRiskMember2021-01-012021-12-310001729750kbnt:CustomerMemberus-gaap:RevenueFromContractWithCustomerMemberus-gaap:CustomerConcentrationRiskMember2021-01-012021-12-310001729750kbnt:CustomerEMemberus-gaap:AccountsReceivableMemberus-gaap:CustomerConcentrationRiskMember2021-01-012021-12-310001729750kbnt:CustomerDMemberus-gaap:RevenueFromContractWithCustomerMemberus-gaap:CustomerConcentrationRiskMember2021-01-012021-12-310001729750kbnt:CustomerBMemberus-gaap:AccountsReceivableMemberus-gaap:CustomerConcentrationRiskMember2021-01-012021-12-310001729750us-gaap:CostOfGoodsProductLineMemberus-gaap:SupplierConcentrationRiskMemberkbnt:TopFourSuppliersMember2020-01-012020-12-310001729750us-gaap:CostOfGoodsProductLineMemberus-gaap:SupplierConcentrationRiskMemberkbnt:SupplierDMember2020-01-012020-12-310001729750us-gaap:CostOfGoodsProductLineMemberus-gaap:SupplierConcentrationRiskMemberkbnt:SupplierBMember2020-01-012020-12-310001729750kbnt:TopThreeCustomersMemberus-gaap:AccountsReceivableMemberus-gaap:CustomerConcentrationRiskMember2020-01-012020-12-310001729750kbnt:TopFiveCustomersMemberus-gaap:RevenueFromContractWithCustomerMemberus-gaap:CustomerConcentrationRiskMember2020-01-012020-12-310001729750kbnt:CustomerMemberus-gaap:RevenueFromContractWithCustomerMemberus-gaap:CustomerConcentrationRiskMember2020-01-012020-12-310001729750kbnt:CustomerMemberus-gaap:AccountsReceivableMemberus-gaap:CustomerConcentrationRiskMember2020-01-012020-12-310001729750kbnt:CustomerGMemberus-gaap:RevenueFromContractWithCustomerMemberus-gaap:CustomerConcentrationRiskMember2020-01-012020-12-310001729750kbnt:CustomerFMemberus-gaap:RevenueFromContractWithCustomerMemberus-gaap:CustomerConcentrationRiskMember2020-01-012020-12-310001729750us-gaap:IPOMember2020-12-280001729750kbnt:Plan2021Member2021-12-310001729750kbnt:Plan2017Member2021-12-310001729750kbnt:TwoThousandSeventeenStockOptionPlanMember2021-12-310001729750kbnt:UnderwritersMember2020-12-280001729750kbnt:TwoThousandSeventeenEquityIncentivePlanMember2020-11-090001729750us-gaap:WarrantMember2020-08-1400017297502019-12-310001729750kbnt:MediacrossingIncMemberkbnt:RestrictiveCovenantAgreementsMember2021-11-300001729750kbnt:MediacrossingIncMemberkbnt:CustomerContractsAndRelatedCustomerRelationshipsMember2021-11-300001729750kbnt:MediacrossingIncMember2021-11-302021-11-300001729750kbnt:MediacrossingIncMember2020-01-012020-12-310001729750kbnt:MediacrossingIncMember2021-01-012021-12-310001729750us-gaap:WarrantMember2021-01-012021-12-310001729750us-gaap:RestrictedStockUnitsRSUMember2021-01-012021-12-310001729750us-gaap:RestrictedStockMember2021-01-012021-12-310001729750us-gaap:EmployeeStockMember2021-01-012021-12-310001729750us-gaap:WarrantMember2020-01-012020-12-310001729750us-gaap:EmployeeStockMember2020-01-012020-12-310001729750us-gaap:CustomerListsMember2021-01-012021-12-310001729750kbnt:RestrictiveCovenantAgreementsMember2021-01-012021-12-310001729750kbnt:AcquiredSoftwareMember2021-01-012021-12-310001729750kbnt:AcquiredDataMember2021-01-012021-12-310001729750kbnt:AccumulatedAmortizationMember2021-01-012021-12-310001729750kbnt:AcquiredSoftwareMember2020-01-012020-12-310001729750kbnt:AcquiredDataMember2020-01-012020-12-310001729750kbnt:AccumulatedAmortizationMember2020-01-012020-12-310001729750us-gaap:TechnologyServiceMember2021-01-012021-12-310001729750us-gaap:SellingAndMarketingExpenseMember2021-01-012021-12-310001729750us-gaap:GeneralAndAdministrativeExpenseMember2021-01-012021-12-310001729750us-gaap:TechnologyServiceMember2020-01-012020-12-310001729750us-gaap:SellingAndMarketingExpenseMember2020-01-012020-12-310001729750us-gaap:GeneralAndAdministrativeExpenseMember2020-01-012020-12-310001729750us-gaap:AdditionalPaidInCapitalMember2021-01-012021-12-310001729750us-gaap:ShareBasedPaymentArrangementNonemployeeMemberkbnt:Plan2021Memberus-gaap:SubsequentEventMember2022-01-012022-01-010001729750kbnt:TwoThousandSeventeenEquityIncentivePlanMember2021-11-092021-11-090001729750srt:ChiefExecutiveOfficerMember2020-07-282020-07-280001729750srt:ExecutiveOfficerMember2020-01-012020-12-310001729750kbnt:SecondYearBonusOn24MonthAnniversaryMembersrt:VicePresidentMemberus-gaap:PerformanceSharesMemberkbnt:EmploymentAgreementsMember2021-06-042021-06-040001729750kbnt:FirstYearBonusOn12MonthAnniversaryMembersrt:VicePresidentMemberus-gaap:PerformanceSharesMemberkbnt:EmploymentAgreementsMember2021-06-042021-06-040001729750srt:MinimumMemberus-gaap:PerformanceSharesMemberkbnt:Plan2021Memberus-gaap:SubsequentEventMember2022-01-012022-01-010001729750srt:MaximumMemberus-gaap:PerformanceSharesMemberkbnt:Plan2021Memberus-gaap:SubsequentEventMember2022-01-012022-01-010001729750kbnt:PaycheckProtectionProgramLoanCaresActMember2021-12-310001729750kbnt:PaycheckProtectionProgramLoanCaresActMember2020-12-310001729750kbnt:TwoThousandSeventeenStockOptionPlanMember2021-01-012021-12-310001729750kbnt:UnderwritersMember2020-12-282020-12-280001729750srt:BoardOfDirectorsChairmanMemberkbnt:Plan2017Member2021-01-012021-03-310001729750kbnt:EmployeesMemberkbnt:Plan2017Member2021-04-012021-06-300001729750kbnt:NonEmployeesMemberkbnt:Plan2017Member2020-01-012020-12-310001729750kbnt:EmployeesMemberkbnt:Plan2017Member2020-01-012020-12-310001729750kbnt:NotesPayableRelatedPartiesMember2021-12-310001729750us-gaap:CommonStockMember2020-01-012020-12-310001729750srt:MinimumMember2021-01-012021-12-310001729750srt:MaximumMember2021-01-012021-12-310001729750us-gaap:IPOMember2020-12-282020-12-280001729750us-gaap:IPOMember2020-08-142020-08-1400017297502020-08-142020-08-140001729750us-gaap:ConvertibleNotesPayableMember2020-08-140001729750kbnt:HoldersOfNotesPayableMember2020-08-1400017297502020-08-140001729750us-gaap:ConvertibleNotesPayableMember2020-08-120001729750kbnt:WarrantsExercisePriceTwoMember2021-01-012021-12-310001729750kbnt:WarrantsExercisePriceThreeMember2021-01-012021-12-310001729750kbnt:WarrantsExercisePriceOneMember2021-01-012021-12-310001729750kbnt:WarrantsExercisePriceFourMember2021-01-012021-12-310001729750kbnt:WarrantsExercisePriceFiveMember2021-01-012021-12-310001729750kbnt:WarrantsExercisePriceTwoMember2021-12-310001729750kbnt:WarrantsExercisePriceThreeMember2021-12-310001729750kbnt:WarrantsExercisePriceOneMember2021-12-310001729750kbnt:WarrantsExercisePriceFourMember2021-12-310001729750kbnt:WarrantsExercisePriceFiveMember2021-12-310001729750us-gaap:OverAllotmentOptionMember2020-08-140001729750us-gaap:IPOMember2020-08-140001729750kbnt:AureusHoldingsLlcDBLo70sMemberus-gaap:SettledLitigationMemberus-gaap:SubsequentEventMember2022-03-142022-03-140001729750kbnt:MediacrossingIncMember2021-11-300001729750kbnt:AdvisioSolutionsLlcMember2021-06-042021-06-040001729750kbnt:ChiefTechnologyOfficerMember2021-11-292021-11-290001729750kbnt:ChiefProductOfficerMember2021-04-092021-04-090001729750srt:VicePresidentMemberus-gaap:PerformanceSharesMemberkbnt:EmploymentAgreementsMember2021-06-042021-06-040001729750kbnt:AureusHoldingsLlcDBLo70sMemberus-gaap:SettledLitigationMember2021-12-310001729750us-gaap:AdditionalPaidInCapitalMember2020-01-012020-12-310001729750us-gaap:OverAllotmentOptionMember2020-12-282020-12-2800017297502020-01-012020-12-3100017297502021-12-3100017297502020-12-310001729750us-gaap:WarrantMember2021-01-012021-12-310001729750us-gaap:CommonStockMember2021-01-012021-12-3100017297502021-06-3000017297502022-03-2500017297502021-01-012021-12-31xbrli:sharesiso4217:USDiso4217:USDxbrli:sharesxbrli:purekbnt:itemkbnt:installment

Table of Contents

UNITED STATES

SECURITIES AND EXCHANGE COMMISSION

Washington, D.C. 20549

FORM 10-K

ANNUAL REPORT PURSUANT TO SECTION 13 OR 15(d) OF THE SECURITIES EXCHANGE ACT OF 1934

For the fiscal year ended December 31, 2021

or

TRANSITION REPORT PURSUANT TO SECTION 13 OR 15(d) OF THE SECURITIES EXCHANGE ACT OF 1934

For the transition period from                     to                    

Commission file number 001-39441

KUBIENT, INC.

(Exact Name of Registrant as Specified in Its Charter)

Delaware


82-1808844

State or Other Jurisdiction of
Incorporation or Organization

I.R.S. Employer
Identification No.

500 7th Avenue, 8th Floor

New York, NY


10018

Address of Principal Executive Offices

Zip Code

800-409-9456

Registrant’s telephone number, including area code

Securities registered pursuant to Section 12(b) of the Act:

Title of each class


Trading Symbol(s)


Name of each exchange on which registered

Common Stock

KBNT

Nasdaq

Common Stock Purchase Warrants

KBNTW

Nasdaq

Securities registered pursuant to Section 12(g) of the Act: None

Indicate by check mark if the registrant is a well-known seasoned issuer, as defined in Rule 405 of the Securities Act.  Yes    No 

Indicate by check mark if the registrant is not required to file reports pursuant to Section 13 or 15(d) of the Act.  Yes    No 

Note – Checking the box above will not relieve any registrant required to file reports pursuant to Section 13 or 15(d) of the Exchange Act from their obligations under those Sections.

Indicate by check mark whether the registrant (1) has filed all reports required to be filed by Section 13 or 15(d) of the Securities Exchange Act of 1934 during the preceding 12 months (or for such shorter period that the registrant was required to file such reports), and (2) has been subject to such filing requirements for the past 90 days.  Yes      No 

Indicate by check mark whether the registrant has submitted electronically every Interactive Data File required to be submitted pursuant to Rule 405 of Regulation S-T (§ 232.405 of this chapter) during the preceding 12 months (or for such shorter period that the registrant was required to submit such files).  Yes     No 

Indicate by check mark whether the registrant is a large accelerated filer, an accelerated filer, a non-accelerated filer, smaller reporting company, or an emerging growth company. See the definitions of “large accelerated filer,” “accelerated filer,” “smaller reporting company,” and “emerging growth company” in Rule 12b-2 of the Exchange Act.

Large accelerated filer 

Accelerated filer 

Non-accelerated filer  

Smaller reporting company 

Emerging growth company 

If an emerging growth company, indicate by check mark if the registrant has elected not to use the extended transition period for complying with any new or revised financial accounting standards provided pursuant to Section 13(a) of the Exchange Act.  

Indicate by check mark whether the registrant has filed a report on and attestation to its management’s assessment of the effectiveness of its internal control over financial reporting under Section 404(b) of the Sarbanes-Oxley Act (15 U.S.C. 7262(b)) by the registered public accounting firm that prepared or issued its audit report.  

Indicate by check mark whether the registrant is a shell company (as defined in Rule 12b-2 of the Act).  Yes   No 

The aggregate market value of the voting and non-voting common equity held by non-affiliates of the registrant, based upon the closing price of common stock on June 30, 2021 of $5.71 per share, was approximately $64,423,000. Shares of voting stock held by each executive officer, director and 10% stockholders have been excluded from this calculation. This determination of affiliate status is not necessarily a conclusive determination for other purposes.

As of March 25, 2022, there were 14,303,743 shares of the registrant’s common stock outstanding.

DOCUMENTS INCORPORATED BY REFERENCE

None.

Table of Contents

TABLE OF CONTENTS

Page

PART I

1

Item 1.

Business

1

Item 1A.

Risk Factors

14

Item 1B.

Unresolved Staff Comments

14

Item 2.

Properties

14

Item 3.

Legal Proceedings

14

Item 4.

Mine Safety Disclosures

14


PART II

15

Item 5.

Market for Registrant’s Common Equity, Related Shareholder Matters, and Issuer Purchases of Equity Securities

15

Item 6.

[Reserved]

16

Item 7.

Management’s Discussion and Analysis of Financial Condition and Results of Operations

16

Item 7A.

Quantitative and Qualitative Disclosures about Market Risk

22

Item 8.

Financial Statements and Supplementary Data

23

Item 9.

Changes in and Disagreements with Accountants on Accounting and Financial Disclosure

24

Item 9A.

Controls and Procedures

24

Item 9B.

Other Information

25

Item 9C.

 Disclosure Regarding Foreign Jurisdictions that Prevent Inspections.

25

PART III

26

Item 10.

Directors, Executive Officers and Corporate Governance

26

Item 11.

Executive Compensation

36

Item 12.

Security Ownership of Certain Beneficial Owners and Management and Related Shareholder Matters

44

Item 13.

Certain Relationships and Related Transactions, and Director Independence

46

Item 14.

Principal Accounting Fees and Services

48

PART IV

49

Item 15.

Exhibits and Financial Statement Schedules

49

Item 16.

Form 10-K Summary

50

SIGNATURES

51

Table of Contents

USE OF MARKET AND INDUSTRY DATA

This Annual Report on Form 10-K includes market and industry data that we have obtained from third-party sources, including industry publications, as well as industry data prepared by our management on the basis of its knowledge of and experience in the industries in which we operate (including our management’s estimates and assumptions relating to such industries based on that knowledge). Management has developed its knowledge of such industries through its experience and participation in these industries. While our management believes the third-party sources referred to in this Annual Report on Form 10-K are reliable, neither we nor our management have independently verified any of the data from such sources referred to in this Annual Report on Form 10-K or ascertained the underlying economic assumptions relied upon by such sources. Furthermore, internally prepared and third-party market prospective information, in particular, are estimates only and there will usually be differences between the prospective and actual results, because events and circumstances frequently do not occur as expected, and those differences may be material. Also, references in this Annual Report on Form 10-K to any publications, reports, surveys or articles prepared by third parties should not be construed as depicting the complete findings of the entire publication, report, survey or article. The information in any such publication, report, survey or article is not incorporated by reference in this Annual Report on Form 10-K.

TRADEMARKS, TRADE NAMES AND SERVICE MARKS

“Kubient” and other trademarks or service marks of Kubient, Inc. appearing in this registration statement are the property of Kubient, Inc. The other trademarks, trade names and service marks appearing in this Annual Report on Form 10-K are the property of their respective owners. Solely for convenience, the trademarks and trade names in this Annual Report on Form 10-K are referred to without the ® and ™ symbols, but such references should not be construed as any indicator that their respective owners will not assert, to the fullest extent under applicable law, their rights thereto.

OTHER PERTINENT INFORMATION

Unless the context otherwise indicates, when used in this Annual Report on Form 10-K, the terms “Kubient” “we,” “us,” “our,” the “Company” and similar terms refer to Kubient, Inc., a Delaware corporation and its wholly-owned subsidiary, Fidelity Media, LLC.

CAUTIONARY NOTE REGARDING FORWARD-LOOKING STATEMENTS

This report contains forward-looking statements within the meaning of the federal securities laws, which statements involve substantial risks and uncertainties. Forward-looking statements generally relate to future events or our future financial or operating performance. All statements of historical fact included in this report regarding our strategy, future operations, financial position, estimated revenues and losses, projected costs, prospects, plans and objectives of management are forward-looking statements. In some cases, you can identify forward-looking statements because they contain words such as “may,” “should,” “expects,” “plans,” “anticipates,” “could,” “intends,” “target,” “projects,” “contemplates,” “believes,” “estimates,” “predicts,” “potential” or “continue” or the negative of these words or other similar terms or expressions that concern our expectations, strategy, plans or intentions. These forward-looking statements are based on management’s current beliefs, based on currently available information, as to the outcome and timing of future events. Forward-looking statements contained in this report include, but are not limited to, statements about:

·

our future financial performance, including our expectations regarding our revenue, annual recurring revenue, gross profit or gross margin, operating expenses, ability to generate cash flow, revenue mix and ability to achieve and maintain future profitability;

·

our beliefs regarding the possible effects of the widespread domestic and global impact of the COVID-19 pandemic, including on general economic conditions, public health, and consumer demand and financial markets, as well as our results of operations, liquidity, capital resources, and general performance in the future;

·

anticipated trends and growth rates in our business and in the markets in which we operate;

·

our ability to maintain and expand our customer base;

·

our ability to sell our platform, inclusive of KAI and expand internationally;

i

Table of Contents

·

our ability to anticipate market needs and successfully develop new and enhanced solutions to meet those needs;

·

our ability to hire and retain necessary qualified employees to grow our business and expand our operations;

·

the evolution of technology affecting our platform; and

·

our ability to adequately protect our intellectual property.

We caution you that the foregoing list may not contain all of the forward-looking statements made in this report.

You should not rely upon forward-looking statements as predictions of future events. We have based the forward-looking statements contained in this report primarily on our current expectations and projections about future events and trends that we believe may affect our business, financial condition, results of operations and prospects. The outcome of the events described in these forward-looking statements is subject to risks, uncertainties and other factors described elsewhere in this report. Moreover, we operate in a very competitive and rapidly changing environment. New risks and uncertainties emerge from time to time and it is not possible for us to predict all risks and uncertainties that could have an impact on the forward-looking statements contained in this report. We cannot assure you that the results, events and circumstances reflected in the forward-looking statements will be achieved or occur, and actual results, events or circumstances could differ materially from those described in the forward-looking statements.

GLOSSARY

“Ad network” means an intermediary network or company that acts as a broker between advertisers who want to purchase ad placements and content publishers who want to host the advertiser’s ads. Examples of advertisers are consumer good companies, multimedia companies and automobile manufacturers. Publishers in the context are website operators or app developers.

“Audience Marketplace” means the modular, highly scalable, transparent, cloud-based software platform created by the Company for real-time trading of digital, Programmatic Advertising.

“Bot” or “internet bot” means an autonomous program (or robot) running on a network (usually, the internet) that can interact with computer systems or users. Typically, Bots perform tasks that are both simple and structurally repetitive, at a much higher rate than would be possible for a human alone. According to Imperva, more than half of all web traffic is fraudulent, as it is made up of Bots rather than actual human beings.

“Brand” means a particular name used to identify a type of product or products manufactured by a particular company.

“Demand Side Platform” or “DSP” means a system that allows buyers of digital advertising space (ie, advertisers) to manage multiple ad exchange and data exchange accounts through one interface.

“Full stack” means computer engineering that encompasses databases, servers, systems engineering, and clients, across mobile applications, web-based applications and native applications.

“Latency” means the lag time between a customer click on an internet link and the conversion of that customer to a sale. The term can also refer to the lag time between ad inventory’s purchase and its display on publisher’s media.

“Omni-channel marketing” means marketing that is intended to reach target consumers across all advertising channels — mobile, video, desktop, and more — within the context of how the specific customer has interacted with a brand (for example, those first seeing an ad about a brand they have never experienced will receive a different message from those who have engaged with that brand a number of times).

“Programmatic advertising” means the purchase of advertising space meant to target audiences using software and tools that help agencies and brands target, deliver, and analyze their digital advertising efforts., rather than the traditional method of purchasing time slots in mass media, such as television programming.

“Pre-bid” means the bid placed by an advertiser for placement of its ad, verified prior to such ad being run or displayed.

ii

Table of Contents

“Post-bid” means the verification of the running or display of an ad, after such running or display has occurred.

“Publisher” means a source of ad inventory, such as website owners, website operators or app developers. Publishers are generally either managed or owned and operated. An owned and operated publisher receives 100% of the profit for impressions sold. This is opposed to a managed publisher: a publisher that does not own its inventory but has a financial relationship with those who do.

“Supply Side Platform” or “SSP” means a platform that enables Publishers to access advertiser demand from a variety of networks, exchanges, and platforms via one interface.

“300-millisecond window” means the window of time adopted by the digital advertising industry in which a website or app has to load the content on their website and auction off the advertising space on their web property.

“Volume” means the concept buying large scale amounts of media in hopes of reaching a specific, smaller audience that lives within that larger pool.

iii

Table of Contents

PART I

ITEM 1. BUSINESS

Overview

Kubient, Inc. (“Kubient,” “we,” “our,” or the “Company”), a Delaware corporation, was incorporated in May 2017 to solve some of the most significant problems facing the global digital advertising industry.

The Company’s experienced team of marketing and technology veterans has developed the Audience Marketplace, a modular, highly scalable, transparent, cloud-based software platform for real-time trading of digital, Programmatic Advertising. The Company’s platform’s open marketplace gives both advertisers (ad space buyers) and Publishers (ad space sellers) the ability to use machine learning in the most critical parts of any Programmatic Advertising inventory auction, while simultaneously and significantly reducing those advertisers and Publishers’ exposure to fraud, specifically in the Pre-bid environment.

The Company also provides unique capabilities with its proprietary pre-bid ad fraud detection & prevention, Kubient Artificial Intelligence (“KAI”), which has the ability to stop fraud in the critical 300 millisecond window before an advertiser spends their budget on fraudulent ad space. The technology is powered by deep learning algorithms, the latest advancement in machine learning, which allows the Company to ingest vast amounts of data, find complex patterns in the data and make accurate predictions. Most importantly, it’s self-learning, getting smarter and more accurate over time. This provides advertisers a powerful tool capable of preventing the purchase of ad fraud.

The Company believes that its Audience Marketplace technology allows advertisers to reach entire audiences rather than buying single impressions from disparate sources.  By becoming a one stop shop for advertisers and publishers, providing them with the technology to deliver meaningful messages to their target audience, all in one place, on a single platform that is computationally efficient, transparent, and as safely fraud-free as possible, the Company believes that its Audience Marketplace platform (and the application of the platform’s machine learning algorithms) leads to increased publisher revenue, lower advertiser cost, reduced latency and increased economic transparency during the advertising auction process.

Recent Updates

Paul Roberts Promoted to Chief Executive Officer

On December 16, 2021, the Company’s board of directors (with Paul Roberts abstaining from the vote) determined to remove the designation of “interim” from Mr. Roberts’ title, effective immediately, such that Mr. Roberts is now the Company’s Chief Executive Officer, Chief Strategy Officer, President and Chairman. This action represents a change in title only and Mr. Robert’s authority and power and duties and responsibilities remain the same.

MediaCrossing, Inc. Acqui-hire

On November 30, 2021, the Company entered into and consummated an Asset Purchase Agreement between the Company and MediaCrossing Inc., a Delaware corporation (“MediaCrossing”) pursuant to which the Company acquired certain assets of MediaCrossing for (i) $500,000 in cash, and (ii) if the acquired business achieves certain milestones in 2022, up to 822,369 shares of the Company’s common stock.  In connection with the transaction, the Company offered employment to ten employees of MediaCrossing, including the hiring of Michael Kalman, Founder and Former CEO of MediaCrossing, for the newly-created role of President – Agency & Brand Partnerships. Mr. Kalman brings his experience from working with leading brands to help direct the Company’s new Managed Services division, which is described in further detail later in this Annual Report on Form 10-K.

Upon the closing of the transaction, MediaCrossing was rebranded as Kubient Managed Services (“KMS”). KMS will continue to operate as a digital-first media buying agency focused on driving growth for both brands and agencies. KMS’s mission is to provide the advertising tools, technology and expertise necessary for brand leaders to focus on what matters most - growing their business. KMS leverages technology and multi-tactic initiatives to drive performance and exceed client requested KPIs through continuous innovation and client service. KMS intends to act as a true extension of our clients’ advertising teams; handling all media strategy development,

1

Table of Contents

planning, buying and analytics, in conjunction with offering a multitude of tactics for our clients including programmatic advertising, paid social, paid search, search engine optimization, direct to publisher, and traditional media advertising.

Mitchell Berg Appointment

Effective November 29, 2021, Mitchell Berg was appointed to serve as its Chief Technology Officer of the Company.  Mr. Berg was appointed after the Company’s board of directors accepted Pavel Medvedev’s resignation effective as of November 30, 2021. Mr. Medvedev’s resignation was not in connection with any known disagreement with the Company on any matter relating to the Company’s operations, policies, or practices.

Mitchell Berg, 60, brings close to 20 years’ experience as a senior information technology executive, including several stints as Chief Technology Officer at a number of leading digital marketplaces.  Most recently, Mr. Berg worked as the Chief Technology Officer of Koddi Inc., an ad-tech marketplace, from March 2020 to October 2021.  From June 2018 to March, 2020 he served as the Chief Technology Officer of Vroom Inc. (NASDAQ:VRM), an-online car buying marketplace. From August 2016 to March 2018, Mr. Berg served as the Senior Vice President of dailymotion, a publisher-side video advertising platform that is a subsidiary of the international media conglomerate Vivendi SE (Euronext:VIV).  From July 2014 to August 2016, he was the Vice President of Display Advertising at IgnitionOne, Inc., a digital display advertising platform that was acquired by the multinational advertising company, Publicis Groupe (Euronext:PUB).  From March 2014 to July 2014, he served as the Principal Architect at Cablevision Systems Corporation (NYSE:CVC), a cable television company which was acquired by Altice Europe N.V. (Euronext:ATC).  From November 2012 to February 2014 he worked as the Vice President of Engineering at Kikin, Inc., an internet search engine.  Mr. Berg has also held senior information technology positions at SEMplest LLC, BenefitPlan Manager Corp. and The Boeing Company (NYSE: BA).  Mr. Berg holds a Bachelor of Science in Industrial Engineering and Computer Science from the University at Buffalo, a Master of Engineering in Systems Engineering from the University of Virginia, a Master of Business Administration in Technology Management from the University of Washington, and a Doctor of Philosophy in Industrial Engineering from the University of Pittsburgh.

There are no arrangements or understandings between Mr. Berg and any other persons pursuant to which he was appointed Chief Technology Officer. There are no family relationships between Mr. Berg and any director or executive officer of the Company, and Mr. Berg does not have any direct or indirect material interest in any transaction required to be disclosed pursuant to Item 404(a) of Regulation S-K.

Russian Sanctions

The current invasion of Ukraine by Russia has escalated tensions among the United States, the North Atlantic Treaty Organization (“NATO”) and Russia. The United States and other NATO member states, as well as non-member states, have announced new sanctions against Russia and certain Russian banks, enterprises and individuals. Violation of such sanctions could result in civil and criminal, monetary and non-monetary penalties, disruptions to our business, limitations on our ability to import and export products and services, and damage to our reputation. As a result, the Company had terminated 10 contractors performing software engineering services as of March 25, 2022. As a result, the Company does not currently employ or contract with any engineers located in Russia. The current political climate has reduced the available number of engineers for hire in such regions.  Furthermore, on-going conflict in Ukraine and the spread of political tensions in surrounding areas could increase the threat of cyberwarfare as well as wide-spread internet service interruptions, which would likely disrupt or delay the operations of many digitally-focused companies such as our own.

COVID-19

The novel coronavirus (“COVID-19”) pandemic continues to impact global economic conditions, as well as the Company's operations. COVID-19 had a meaningful negative impact on our financial condition, cash flows and results of operations during 2020, as revenues declined and we reduced spending in light of COVID-19 uncertainty. Although we continued to experience disruption and volatility during 2021, which could continue to have an adverse effect on our revenues and earnings in 2022, the ultimate economic impact of the pandemic remains fluid, as there continue to be periods of COVID-19 resurgence in various parts of the world. The extent of the impact of the COVID-19 pandemic in 2022 on our operational and financial performance will depend on a variety of factors, some of which are outside our control, including the duration and spread of COVID-19 and its variants, and its impact on our clients, partners, industry, and employees, all of which are uncertain at this time and cannot be accurately predicted.

2

Table of Contents

Similarly, the economic uncertainty caused by the COVID-19 pandemic has made and may continue to make it difficult for us to forecast revenue and operating results and to make decisions regarding operational cost structures and investments. We have committed, and we plan to continue to commit, resources to grow our business, employee base, and technology development, and such investments may not yield anticipated returns, particularly if worldwide business activity continues to be impacted by the COVID-19 pandemic. The duration and extent of the impact from the COVID-19 pandemic depend on future developments that cannot be accurately predicted at this time, and if we are not able to respond to and manage the impact of such events effectively, our business may be harmed.

There can be no assurance that precautionary measures, whether adopted by us or imposed by others, will be effective, and such measures could negatively affect our sales, marketing, and client service efforts, delay and lengthen our sales cycles, decrease our employees’, clients’, or partners’ productivity, or create operational or other challenges, any of which could harm our business and results of operations.

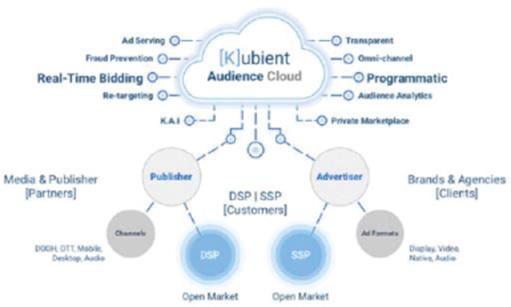
What We Do: Audience-Based Marketing on Our Full Stack Platform

Our Audience Marketplace’s platform enables advertisers and publishers to transact directly between each other on an open, end to end real-time bidding platform for programmatic digital advertising. The advertising inventory on our platform is available in any channel: desktop, mobile, digital out-of-home, and connected devices; and in any format: video, display, audio, and native. Indeed, we believe our single, fully integrated audience platform provides a comprehensive, fraud-minimized, transparent, independent advertising marketplace that facilitates intelligent decision-making, and automated transaction execution for the programmatic advertising industry. We optimize the liquidity and effectiveness of the advertising supply chain, increasing revenue for publishers and improving return on investment for advertisers.

Our platform offers a machine learning-powered fraud prevention solution, extremely low latency times and an audience management platform which provides omni-channel access into all advertising channels, inventory and ad formats. Thanks to our management and development teams’ deep experience with artificial intelligence applications, our platform is constantly self-optimizing, using our software’s ability to analyze and learn from vast volumes of data. We are confident that the additional data we obtain from the volume of transactions on our platform helps to make our machine-learning algorithms more intelligent over time.

Advertising is sometimes defined as the transfer of a message from one party to another for the purpose of education, motivation or suggestion. Advertisers who pay to send a message, should be confident that it arrives to the individual it was intended for and delivers its expected outcome. Our solution consistently ensures this is the case, by verifying each and every message and intended audience. As a result, we believe that we process, analyze and connect billions of audience participants and devices faster and more efficiently than the industry standard.

Graphic

3

Table of Contents

Digital Advertising Fraud Solution: Machine Learning Combined with Artificial Intelligence

Thanks to advances in technology, the advertising inventory that is bought and sold in these real time auctions during the bid stream is customized to each individual viewer. This viewer customization is often called programmatic advertising, a new form of advertising where advertisers are able to specifically target their preferred audiences and demographics (rather than placing ads in generic public forums such as billboards or during live events, in hopes that the coveted audience or demographic sees the ad). According to eMarketer, digital advertising is one of the fastest growing sectors in the advertising industry, which is expected to reach $717.44 billion by 2024; rising from $380.75 billion in 2020. Worldwide digital ad spending surged by 29% in the trailing year of 2021 to a total of $491.70 billion. Digital programmatic advertising’s reach includes channels such as online, mobile browsing, in-app, text messages, “out of home” video advertising (in locations such as gas stations and airports) and digital or internet television services. The explosive growth of programmatic digital advertising has created unique challenges for advertisers and publishers that want to connect and engage their audiences. One of the primary challenges facing the digital advertising industry is that, like the meteoric growth of digital advertising itself, fraud is also growing rapidly. Despite attempts by advertisers and publishers to prevent fraud and conduct quality assurance checks, both Forrester Research and Juniper Research estimates that the losses experienced by advertisers will more than double to $100 billion in 2023, with advertisers losing an estimated 25% of every dollar spent due to fraud. Additionally, programmatic advertising was seen by the majority of industry professionals as the overwhelming medium at highest risk of compromise to fraud. In a market of spent advertising dollars projected to increase almost 50% from 2020-2025, the total addressable market for properly servicing ad fraud is ripe for the picking.

Digital advertising fraud occurs when an ad is displayed to a fake website or Bot in an effort to falsely inflate web traffic numbers, rather than being displayed to a legitimate web site to be viewed by a human being. An advertiser that pays for an ad that is displayed to a Bot has wasted the budget spent for the placement of that ad, as it is human beings that might spend money on the product or service being advertised, as opposed to a Bot. Thus, brands and advertisers that cannot prevent their ads being shown to Bots become victims to the billions of dollars lost to ad fraud annually, as calculated by Juniper Research and Forrester Consulting.

We believe that digital advertising fraud is further exacerbated by the fact that our industry is increasingly fragmented. The most popular solutions that have emerged in the marketplace for selling digital advertising are not connected to the solutions used by industry participants for purchases of digital advertising. In other words, advertisers use DSPs to purchase digital advertising, whereas publishers use completely different platforms called SSPs to sell advertising space to those advertisers. Therefore, advertisers may not know who is selling them advertising inventory, and publishers may not know who is purchasing such inventory. With the two sides of any auction not connected, and likely not communicating with each other across different platforms, it is difficult to assign responsibility to tracking down fraud after an ad sale has already occurred. We have created a marketplace where advertisers and publishers can interact directly. This layer of direct transparency allows advertisers to more efficiently identify ad fraud, and to ensure that they are only buying advertising space that delivers the expected value of a particular campaign. Furthermore, fraud prevention is also fragmented as a result of advertisers and publishers using different platforms to conduct digital advertising auctions. Indeed, many DSPs and SSPs do not even have built-in fraud prevention solutions, instead relying on third parties to identify ad fraud after an ad is displayed. Our internally-developed fraud prevention solution is native to our platform and detects fraud before the digital advertising auction is concluded.

As a result of the fragmented, complex and inefficient infrastructure currently in use for programmatic advertising, fraud is rampant in the digital advertising marketplace. Bad actors’ use of fake websites and Bots to sell advertising space costs advertisers billions of dollars a year. A large part of the reason that widespread fraud runs rampant in the digital advertising industry is that current machine learning and fraud prevention solutions in our industry can only identify such fraud after an ad purchase has already occurred. We believe it is much harder to stop fraud when trying to catch perpetrators after the fraud has already occurred because the fraudsters have the ability to completely change the fingerprint of the Bot, which allows it to reenter the ecosystem and commit fraud again.

4

Table of Contents

We believe it is more effective to stop fraud before it occurs than trying to catch perpetrators after the fraud has already occurred. Thus, we have developed what we believe to be the first machine learning technology that can detect fraud within the 300-millisecond window known as the “bid stream” prior to ad purchases. Our platform’s fraud detection solution, called Kubient Artificial Intelligence (“KAI”) is our patent-pending proprietary technology that uses artificial intelligence to analyze live advertising bid stream data to detect potential ad fraud, a major issue within the digital advertising ecosystem. KAI’s proprietary technology allows all advertisers to make better-informed, real-time decisions within this brief window of time by identifying potentially fraudulent activity in real-time. KAI is trained using different statistical and machine learning algorithms and is capable of detecting various types of fraud, including user fraud, device fraud, content fraud and heuristic fraud. KAI analyzes 100% of real-time programmatic data and industry-specific information to determine patterns and data points consistent with fraudulent activity, helping advertisers maximize return on ad spend and protecting publishers. KAI is fully integrated into Kubient’s Audience Marketplace, or alternatively, can be deployed as a standalone application or enterprise solution on third party real time bidding platforms.

Latency Solution: Machine Learning

We believe that our platform allows us to process digital advertising auctions faster than the competition. Faster auctions ensure that ad campaigns create more impressions that are seen by consumers, as consumers are less likely to become frustrated by slowly loading websites or apps (which normally results in consumers leaving such websites or apps before the ad is displayed).

To substantially reduce and minimize latency issues across our fully integrated open marketplace, we use a highly-specialized programming language originally designed to be used in extremely fast (but highly dependable) digital telephone communications switches, as well as quant-based speed trading of securities on Wall Street. In addition, our platform’s proprietary machine-learning algorithms, sophisticated data processing, high volume storage, detailed analytics capabilities, and a distributed infrastructure that supercharges our bidding process and helps our customers place, and win, more bids for advertising space. We believe we are transforming the digital advertising industry by analyzing billions of data points in record real time speed to enable our solution to make complex decisions in milliseconds, and to execute over 1 million queries per second, billions of transactions per week and trillions of bid requests per month.

Additional Platform Functionalities

Not only do we believe our platform works faster, more efficiently and more safely in terms of fraud than our competition, we also believe that it provides added functionality over our competitors, such as real time reporting of ad sales, and an open audience marketplace which enables publishers, including websites, mobile applications, video and other digital media properties, to connect their advertising inventory more efficiently and effectively to buyers across the entire advertising ecosystem, including brands, DSPs, ad networks and advertising agencies.

In addition, our platform’s functionality allows us to quickly adapt to emerging media channels that might have been previously overlooked by the digital marketing ecosystem. For example, outdoor advertising, often referred to as out of home media, such as billboards, bus-stop shelters, public elevators, airport monitors and gas station pump placards, has not traditionally been connected to digital advertising sources. However, these traditional forms of out of home media are increasingly being converted to digital signage. Unlike their traditional out of home counterparts, these updated digital signs, often referred to as digital out of home (“DOOH”) media, can display programmatic advertising, such that all of the advantages of our Audience Marketplace can be applied to this rapidly proliferating media channel. By allowing brands, DSPs, ad networks, advertising agencies and brands to bid on DOOH publishers’ inventory in real-time, just as if DOOH screens were video screens on a desktop computer or mobile device, our Audience Marketplace will allow advertisers to scale campaigns across new and thriving media channels, thereby maximizing inventory fill rates and increasing the audiences that advertisers may target by digital means.

Kubient Managed Services (KMS)

The Company has embraced platforms, tools and a culture that’s designed to help clients achieve their required outcomes. We remain focused on differentiating by helping advertisers achieve tangible, quantifiable outcomes such as heightened brand awareness and increased sales. As such, the Company believes that its Kubient Managed Services division will be able to benefit advertisers by providing: (i) better audience and performance insight, campaign control, transparency, and execution (ii) expert staff with varied, relevant backgrounds to assist advertisers, and (iii) access to quality tools and platforms for advertisement placement with an emphasis on return on media investment.

5

Table of Contents

Furthermore, KMS will provide advertising agencies and advertisers with several significant competitive advantages relative to existing media buying vendors, such as:

Managed services at scale. KMS provides strategy, planning, execution and reporting to advertising agencies and advertisers that do not have the capital and expertise to deliver impactful programmatic digital media campaigns at scale.
Audience Marketplace and KAI Integration. The company intends to utilize Kubient’s transparent and fraud-free publisher supply from its Audience Marketplace powered by KAI whenever appropriate for (KMS) Managed Service campaigns.
Leveraging data. Digital media advertising is a data-driven industry, and we believe all key players in the space require insightful analytics.  Due to the sheer volume of data available on online users, however, we believe advertisers and agencies have struggled to gain valuable insights in a timely, actionable fashion, especially price action and audience data.
Operating in real-time with transparent reporting. The massive volume and real-time creation of data generally precludes effective human review, analysis, optimization and implementation of advertising campaigns. This, in turn, makes it difficult and timely for existing providers of digital solutions to deliver transparency with in-market campaigns which we’ve solved by providing clients with accurate, reliable dashboard reporting.
Achieving measurable and repeatable results. In aiming to improve methods of measuring campaign success, advertisers are seeking tangible, quantifiable outcomes such as heightened brand awareness and increased sales. Similarly, publishers are demanding higher fill rates and maximum spend from advertisers.

Additional Platform Functionalities

Not only do we believe our platform works faster, more efficiently and more safely in terms of fraud than our competition, we also believe that it provides added functionality over our competitors, such as real time reporting of ad sales, and an open audience marketplace which enables publishers, including websites, mobile applications, video and other digital media properties, to connect their advertising inventory more efficiently and effectively to buyers across the entire advertising ecosystem, including brands, DSPs, ad networks and advertising agencies.

In addition, the acquisition of MediaCrossing and its re-branding to KMS, has also brought Kubient the systems and processes required to execute complex campaigns at scale. With a laser focus on maintaining the agility to adapt to evolving client needs, KMS is designed to execute campaigns with precision regardless of volume, using software and automation that can scale with increased client engagement. This agility also allows the team to adapt to an ever-changing advertising landscape and add new solutions in short order.

Intellectual Property

We have filed two provisional patents, one relating to our inventory and decision management system that allows DOOH media buying agencies to purchase ads on our programmatic and real-time-bidding marketplace, and one relating to our KAI real time, digital advertising fraud prevention solution. In addition, we have filed six registered trademarks, and we have filed an additional trademark application relating to our brand name, corporate logos and KAI product.

Customers and Revenue

We provide our customers with a platform to connect advertisers and publishers. Generally, our revenue generation process begins with publishers. When a publisher aims to fill the available advertising space on its website or app, we typically enter into a twelve-month master service agreement allowing the publisher to sell advertising inventory through our platform. Once the publisher executes our master service agreement and is accepted onto our platform, the publisher is allowed to electronically communicate with our platform through its ad server, in order to provide us information about the publisher’s advertising inventory, user base, minimum sale prices and other data signals, as applicable. We also enter into master service agreements to allow third-party exchanges that aggregate publishers’ available advertising inventory to sell such inventory on our platform. We earn a mark-up, which is the spread between what we collect from advertisers and what we remit to publishers. We only pay for inventory when an advertiser is connected to a publisher and an impression is successfully delivered. We sometimes refer to the amount we pay publishers for inventory upon the delivery of an

6

Table of Contents

impression as “cost pay.” As described further below, cost pay is generally lower than what advertisers ultimately spend to have their ad impression delivered on a publisher’s website or app.

We also typically enter into twelve-month master service agreements with advertisers that wish to purchase advertising inventory, either on our platform or through their DSP. Our proprietary algorithms use the industry information available (from advertisers, publishers, third parties and our own internal database) to automatically target and bid on publishers’ inventory to meet an advertiser’s campaign objective. We generate revenue from advertisers by charging them fees on a sliding scale based on a percentage of their spend on advertising purchased through our platform, the total of which we sometimes refer to as “gross spend.”

Thanks to the speed of our platform, the matching of publisher and advertiser occurs in fractions of a second, within the short time frame of the bidstream. We recognize revenue upon the completion of each matching transaction, at the moment when an impression has been delivered to the consumer viewing a website or application. We generally bill and collect the full purchase price of impressions from advertisers, unless the advertiser pays through its DSP, in which case the DSP is the entity that pays our fees. In either case, our gross revenue from each impression is equal to gross spend minus cost pay.

We consider our customers to be those that generate revenue during the period and is a mix of direct publishers, third-party exchanges that aggregate both publishers’ available advertising inventory and advertising budgets, along with direct advertisers and advertising agencies. Further, the Company’s definition of “customer” encompasses advertisers that purchased even a single impression on the Company’s platform during the period, not just advertisers that signed a twelve-month master service agreement.

We believe that growth of the programmatic advertising market is important for our ability to continually grow our business. Adoption of programmatic advertising by advertisers allows us to acquire new customers and grow revenue from existing customers. We also believe that current industry trends will lead more advertisers to seek out a better fraud prevention solution to protect their advertising budgets, such as the one offered on our platform.

Similarly, we believe that the adoption of programmatic advertising by unique advertising inventory owners, such as digital out of home content providers for which we have developed a unique solution, will allow us to expand the volume and type of advertising inventory that we present to advertisers using our platform.

KAI

In addition, during the first quarter of 2020, we allowed two clients to beta test KAI, our fraud prevention technology powered by machine learning. Our Supply Side Platform also provides KAI with hundreds of millions of rows of data in real-time which improves accuracy, and provides our clients the ability to prevent the purchase of non-human or fraudulent advertising traffic.

Based on the success of the beta test of KAI, beginning in the fourth quarter of 2020, we began providing potential KAI customers with a free KAI audit, which provides our prospective customer with the intricate details of types and quantity of ad-fraud occurring on their platforms as a means of demonstrating KAI’s product differentiation and its ability to prevent ad fraud. After conducting client satisfaction surveys after a series of free KAI audits, the Company discovered that the bulk of its new customers were far more interested in contracting for access to the Audience Marketplace as a whole, rather than contracting for the use of KAI as a standalone product. Accordingly, the Company decided to terminate such free KAI audits, and instead, the Company intends to sell KAI as part of the overall package of solutions available through the Company’s Audience Marketplace.

KMS

With our acquisition of MediaCrossing and re-brand to KMS in November 2021, we are now able to provide middle-market (and sometimes underserved) advertisers and agencies with access to advertising services. KMS is a managed service solution that provides our clients with access to the platforms, people, and processes to plan and activate advertising campaigns across media types and platforms at scale.

The KMS team is staffed by subject matter experts with the expertise required to plan and execute campaigns across programmatic, search, social, and traditional media channels to reach a client’s expected outcome. The services provided to our clients are specific to media planning, buying, and reporting with a focus on digital media formats.

7

Table of Contents

Prior to the acquisition, MediaCrossing was platform agnostic and remains so. This gives the KMS team a broad suite of solutions they can deploy to meet client needs. With the addition of Kubient’s offerings, the solution set has and will continue to grow.

The KMS team has also brought Kubient the systems and processes required to execute complex campaigns at scale. With a laser focus on maintaining the agility to adapt to evolving client needs, KMS is designed to execute campaigns with precision regardless of volume using software and automation that can scale with increased client engagement. This agility also allows the team to adapt to an ever-changing advertising landscape and add new solutions in short order.

KMS primarily operates as an agency of record for brands, but also provides agencies and brands with the skillsets and tools that they lack via more narrow engagements. Whether planning and executing a brand’s annual advertising efforts or pitching in on a project with an agency, the KMS team devotes the same energy and effort to provide a positive outcome for our client.

Growth Strategy

Organic Growth

The key elements of our long-term growth strategy are as follows:

·

Enhancing our existing auction technology to improve adoption among publishers and advertisers, which we expect will increase our revenue.

·

Further developing our fraud prevention system, which is powered by our proprietary KAI machine learning technology.

·

Growing our customer base by increasing our salesforce to engage brands, agencies, website owners, app owners and other connected device owners, to facilitate marketplace participation. This will allow us to reach more audiences and garner larger budgets, growing our revenue and building long lasting customer relationships.

Providing a proficient and cost-effective solution for advertisers and agencies with Kubient Managed Services (KMS) where we deliver strategy, planning, execution and reporting to those constituents that do not have the capital and/or the expertise to deliver impactful digital media campaigns at scale.

·

Launching and scaling our reach with advertisers by introducing real-time auctions into a previously static corners of the marketplace, such as digital out of home channels, allowing for video advertising at gas stations, hotels and airports.

·

Further developing our Audience Marketplace platform to improve omni-channel relevance, and personalization at scale.

·

Further diversifying both our products and revenue streams to include stand-alone applications that address advertisers’ business needs, such as first party data hosting, and audience targeting solutions.

·

Increasing our global footprint across the globe, especially in Latin America, Asia-Pacific, Europe, the Middle East and Africa.

M &A Growth

In addition to the long-term, organic growth discussed above, we intend to opportunistically acquire companies that expand our core technologies and introduce the Company to potential new client bases that are potentially accretive to the Company’s future earnings. At present, Kubient is looking for companies that will grow its existing ecosystem of services by adding additional direct publishers, direct advertising partnerships, as well as ones that provide additional engineering, operational, business development, and human capital resources.

8

Table of Contents

Industry Overview

Most consumers are unaware that when they browse a webpage, watch a video on the internet, use a mobile app or watch an internet-connected TV, there is often a behind-the-scenes auction for the purchase and sale of digital advertising space as the consumer’s desired content loads. In such auctions, advertisers (i.e., ad space buyers, such as sporting goods or consumer products manufacturers) purchase advertising space from publishers (i.e., ad space sellers, such as mobile app developers or website operators). Advertisers bid on each impression and if the bid is won, the ad is displayed on the publisher’s website or app being viewed by the consumer.

As the technology behind these auctions began to develop, traditional methods of digital advertising were used, where manual negotiations conducted by human brokers played a vital role in deciding the prices of digital advertising inventory to be bought and sold. Similarly, human brokers sought to place ad inventory in the digital equivalents of traditional public forums such as billboard-like banner ads or during digitally-broadcast sporting events, in hopes that the largest audience possible might see an ad.

However, in recent years, the technology behind these auctions has changed dramatically. Now, “real time bidding” has become an automated process that enables the buying and selling of individual impressions for each digital ad in milliseconds. In the blink of an eye, real time digital auctions determine what ad will display, where the ad will be displayed and what price the advertiser has to pay to the publisher for displaying the ad. The real time auction process is currently in the process of completely replacing the role of a human broker, by automating the buying and selling of ad space in a 300 millisecond window called the “bid stream.”

Another significant challenge facing participants in the digital marketing industry is the problem of latency, or loading wait times. Existing participants in the digital advertising marketplace have invested billions of dollars in large and cumbersome system infrastructures that are costly and slow by today’s standards. Their outdated infrastructure has caused hundreds of companies to provide a patchwork of solutions to address the slow and costly nature of the current digital advertising infrastructure that we believe are ineffective when compared with our solution. As a result of this patchwork of solutions, we believe the digital advertising marketplace has become complex and inefficient, with relatively long delays before an ad is displayed becoming commonplace. These delays often result in a user leaving a website or smartphone app before the advertiser’s content loads. If the user does not view the ad which the advertiser paid to place on the publisher’s website or app, then the advertiser has wasted the budget spent for the placement of that ad.

The problem of ineffective digital advertising has created large-scale lost revenue in our industry. In their 2020 “Not Another State of Marketing Report”, Hubspot states that only 61% of marketers believe their marketing strategy is effective. Furthermore, 40% of marketers say proving their ROI of their marketing activities is their top marketing challenge, with over 10% indicating that they are unable to measure the ROI of their digital advertising campaigns. Given that ROI is generally the main driver of digital advertising decision making, the inability to calculate it correctly, or at all, will continue to perpetuate the ineffective digital advertising environment.

To combat the large-scale loss in advertising dollars spent, the landscape of marketing from the perspective of metric-based analysis has evolved. In their 2021 “The State of Marketing” report, Salesforce states that marketers are embracing more sophisticated metrics to cater to various KPI standards, with 78% of marketers reprioritizing their metrics due to the previous pandemic conditions. The following metrics are the most tracked by marketing organizations: revenue, marketing/sales funnel performance, customer satisfaction analytics, content engagement, customer acquisition cost, customer retention rates, web/mobile analytics, customer referral rates/volume, and customer lifetime value. While all of these marketing KPIs saw an increase across the board, customer referral rates, customer acquisition costs, and content engagement saw the biggest year-over-year jumps in adoption. Additionally, a related study published by Salesforce estimated that 60% of customer interactions would take place online; a rapid acceleration from the reported 49% in 2019. The increasing need for effective advertising spend has seemingly illuminated the increasing need by both publishers and advertisers to cut fraudulent advertising engagement significantly.

9

Table of Contents

Competition

We derive our revenue from the digital advertising market, which is rapidly evolving, highly competitive, complex and fragmented. We currently compete for advertising spend with large, well-established companies as well as smaller, privately-held companies. Some of our larger competitors with more resources may be better positioned to execute on advertising campaigns conducted over multiple channels such as social media, mobile and video, yet we provide unique channels not found in the digital advertising market typically, such as the true programmatic DOOH auctions we perform. We believe that this, coupled with our other capabilities, will allow us to keep step with the larger competitors in the short term and surpass them in the long term.

While the majority of the market is dominated by two companies, Facebook and Google, we do not consider them to be our competitors. Our growth is focused in the rest of the available market and there are many companies who compete with us for that share. The Trade Desk is one of our fastest growing competitors for brand and advertiser budgets with a solid foundation and strong cash flow and client base. Their product known as a Demand Side Platform competes with our own Demand Side Platform however, we believe our platform has key advantages, such as built-in proprietary fraud prevention, direct publisher connections, a Supply Side Platform and a centralized auction hub. These advantages, in our opinion, provide us with more leverage when approaching advertisers and requesting budget. There are other platforms and exchanges that can be considered a competitor to one or more of our products as well.

A majority of our competitors are significantly larger than we are and have more capital to invest in their businesses however they operate on technology we consider to be outdated and inferior to our newer more agile technology. Competitors could also seek to gain market share by reducing the prices they charge to advertisers, introducing products and solutions that are similar to ours or introducing new technology tools for advertisers and digital media properties, yet the failure of these competitors to offer transparency on pricing as we do is likely to reduce or negate such impact. Moreover, increased competition for video advertising inventory from digital media properties could result in an increase in the portion of advertiser revenue that we must pay to digital media property owners to acquire that advertising inventory which is beneficial to us as our technology offers a more efficient auction thus allowing us to reduce cost for advertisers and increase revenue for publishers.

Some large advertising agencies that represent advertising customers have their own relationships with digital media properties and can directly connect advertisers with digital media properties. Our business will suffer to the extent that our advertisers and digital media properties purchase and sell advertising inventory directly from one another or through other companies that act as intermediaries between advertisers and digital media properties. Other companies that offer analytics, mediation, ad exchange or other third-party solutions have or may become intermediaries between advertisers and digital media properties and thereby compete with us. Any of these developments would make it more difficult for us to sell our solutions and could result in increased pricing pressure, reduced profit margins, increased sales and marketing expenses or the loss of market share.

Other companies that offer analytics, mediation, ad exchange or other third-party solutions have or may become intermediaries between advertisers and digital media properties and thereby compete with us. Despite this, we believe that they do not offer a full software suite like us, as such, the long-term effect of any interruption caused by such companies will be limited.

Our fraud prevention solution competes with the small landscape of other fraud prevention companies such as Human, Double Verify and Integral Ad Science. However, we believe that our product is the only product in this space that has patent pending technology allowing it to perform instream prevention as opposed to the landscapes standard.

10

Table of Contents

Sales and Marketing

Given our self-serve business model, we focus on supporting, advising and training our customers to use our platform independently as soon as they are ready to transact. There is an element of education about our platform that requires us to invest in sales and marketing programs and personnel to grow our business. We focus our efforts to build this awareness through trade shows and sponsored events.

The addition of KMS has augmented our sales and marketing capabilities by adding assigned account managers, real time dashboard monitoring, performance analysis, as well as quarterly client reviews, ensuring that our advertising clients using the Audience Marketplace have all logistics running smoothly and that any assistance they need would be there in an instant.

As of March 25, 2022, our sales and marketing team consisted of 14 employees. The team employs a consultative approach to both new and existing customers. Once a new customer has access to our platform, they work closely with our customer service teams as they onboard the new customer and provide continuous support throughout the early campaigns. Typically, once a customer has gained some initial experience, it will move to a fully self-serve model and request support as needed.

Seasonality

Our cash flows from operations vary from quarter to quarter due to the seasonal nature of advertiser spending. For example, many advertisers devote a disproportionate amount of their advertising budgets to the fourth quarter of the calendar year to coincide with increased holiday purchasing. Indeed, in digital advertising, seasonal downswings typically occur at the start in January (the beginning of the calendar year) and October (the beginning of the fiscal year for many companies). Upswings occur in December (the end of the calendar year) and September (the end of the fiscal year for many companies). This is due to the timing of when budgets are negotiated and distributed. Other swings occur around holidays, and other large consumer focused events such as Black Friday and Cyber Monday.

Platform Development

Part of our dedication to innovation means that we are constantly improving our platform, with new features and products being routinely released. We empower our development teams by encouraging them to release updated features and increase functionality fast and often. As a company, we are always exploring new and better ways to continuously improve the performance of our technology. Our development teams are intentionally lean and nimble in nature, providing for transparency and accountability.

Privacy and Data Protection Regulation

Privacy and data protection legislation and regulation play a significant role in our business. We and our customers use data about Internet users collected through our platform to manage and execute digital advertising campaigns in a variety of ways, including delivering advertisements to Internet users based on their particular geographic locations, the type of device they are using, or their interests as inferred from their web browsing or app usage activities. We do not use this data to identify specific individuals, and we do not seek to associate this data with information that can be used to identify specific individuals. We take steps not to collect or store personally identifiable information, or personal data. The definitions of personally identifiable information and personal data, however, vary by jurisdiction and are evolving. As a result, our platform and business practices must be assessed regularly in each jurisdiction where we do business to avoid violating applicable legislation and regulation.

In the United States, a complex patchwork quilt of both state and federal legislation governs activities such as the collection and use of data by companies like us. Digital advertising in the United States has, up until very recently, primarily been subject to regulation by the Federal Trade Commission, or the FTC, which has primarily relied upon Section 5 of the Federal Trade Commission Act, which prohibits companies from engaging in “unfair” or “deceptive” trade practices, including alleged violations of representations concerning privacy protections and acts that allegedly violate individuals’ privacy interests. The FTC has commenced the examination of privacy issues that arise when marketers track consumers across multiple devices, otherwise known as cross-device tracking.

The United States legal landscape concerning data and privacy continues to evolve at a rapid, and sometimes unpredictable pace. Domestic laws in this area are also complex and developing rapidly. Many state legislatures have adopted legislation that regulates how online business handle data. California recently enacted the California Consumer Privacy Act (“CCPA”), which took effect on January 1, 2020. The CCPA gives California residents expanded rights to access and delete their personal information, opt out of certain personal information sharing, and receive detailed information about how their personal information is used. The CCPA provides for civil

11

Table of Contents

penalties for violations, as well as a private right of action for data breaches that is expected to increase data breach litigation. The CCPA may increase our compliance costs and potential liability. Some observers have noted that the CCPA could mark the beginning of a trend toward more stringent privacy legislation in the United States, which could increase our potential liability and adversely affect our business. Similar privacy legislation has been proposed in a number of states. Indeed, Virginia and Colorado have also enacted similar statutes; the Virginia Consumer Data Protection Act (“VCDPA”), and the Colorado Privacy Act (“CPA”). In addition, a dozen other states have data privacy bills either introduced or in committee, with the expectation that they will be enacted in coming years, further complicating the compliance landscape.

Because our platform reaches users throughout the world, including Europe, Australia and Asia, some of our activities may also be subject to foreign legislation. Internationally, virtually every jurisdiction in which we operate has established its own data security and privacy legal framework with which we or our customers must comply, including but not limited to the European Union. The European Union has adopted what is known as one of the most robust and comprehensive data protection regulations in the world - the General Data Protection Regulation (“GDPR”). The GDPR and contains numerous requirements and obligations on data processors and comprehensive documentation requirements for data protection, processing, and compliance programs. In addition, the GDPR promulgates data subject rights for EU citizens, which provides increased control for Eu citizens. Specifically, EU citizens posses rights of access, corrections, deletion, and portability. These rights translate into increased operational costs to companies who have to take steps to operationalize these rights in order to comply and meet any request. Non-compliance risks substantial fines. Under the GDPR, fines of up to 20 million euros or up to 4% of the annual global revenue of the noncompliant company, whichever is greater, could be imposed for violations of certain of the GDPR’s requirements. In additional the GDPR, the European Union is currently in the process of replacing the current ePrivacy directive with the ePrivacy Regulation, which contains enhanced protections and regulations concerning the use of electronic communications services, including in connection with online tracking technologies.

Accordingly, once the ePrivacy Regulation is enacted, the compliance landscape will only become more challenging. Certainly, an increase in operational costs and risk will arise to the extent we continue to do business in the European market. In particular, risks associated with non-compliance proceedings from governmental agencies, as well as limitations on our ability to attract and retain European customers.  

The interpretation and application of many privacy and data protection laws along with contractually imposed industry standards are simply not predictable in light of the nascent nature of the data privacy legal landscape. These laws may be interpreted and applied in a manner that is inconsistent with our existing data handling practices or how our products and platform capabilities operate. The possibility of fines, lawsuits, and other claims and penalties may necessitate a change in our business activities and practices or modify our products and platform capabilities, which could have an adverse effect on our business.

In prior years, some government regulators and privacy advocates advocated vigorously for a Do Not Track standard that would allow Internet users to express a preference, independent of cookie settings in their browsers, not to have their online browsing activities tracked. In 2010, the FTC issued a staff report emphasizing the need for simplified notice, choice and transparency to the consumer regarding the collection, use and sharing of data, and suggested implementing a Do Not Track browser setting that would allow consumers to choose whether or not to allow tracking of their online browsing activities. All major Internet browsers have implemented some version of a Do Not Track setting. However, there is no commonly accepted definition of “tracking,” no consensus regarding what message is conveyed by a Do Not Track setting and no industry standards regarding how to respond to a Do Not Track preference.

Our Employees and Culture

As of March 25, 2022, we had 38 full time employees, and 3 consultants. None of our employees are represented by a union or parties to a collective bargaining agreement. We believe our employee relations to be good.

Corporate Information

Our mailing address is 500 7th Avenue, 8th Floor, New York, New York 10018. Our telephone number is (800) 409-9456.

12

Table of Contents

Available Information

Our website, www.Kubient.com, provides access, without charge, to our Annual Report on Form 10-K, Quarterly Reports on Form 10-Q, current reports on Form 8-K, and all amendments to those reports as soon as reasonably practicable after such material is electronically filed with the Securities and Exchange Commission (“SEC”). The information provided on our website is not part of this Annual Report and is therefore not incorporated by reference unless such information is otherwise specifically referenced elsewhere in this Annual Report. The SEC also maintains a website at www.sec.gov that contains reports, proxy and information statements, and other information regarding our company that we file electronically with the SEC.

Implications of Being an Emerging Growth Company

We are an “emerging growth company” as defined in the Jumpstart Our Business Startups Act of 2012 (the “JOBS Act”). For as long as we are an emerging growth company, unlike public companies that are not emerging growth companies under the JOBS Act, we will not be required to:

·

provide an auditor’s attestation report on management’s assessment of the effectiveness of our system of internal control over financial reporting pursuant to Section 404(b) of the Sarbanes-Oxley Act of 2002 (the “Sarbanes Oxley Act”);

·

provide more than two years of audited financial statements and related management’s discussion and analysis of financial condition and results of operations;

·

comply with any new requirements adopted by the Public Company Accounting Oversight Board (the “PCAOB”) requiring mandatory audit firm rotation or a supplement to the auditor’s report in which the auditor would be required to provide additional information about the audit and the financial statements of the issuer;

·

provide certain disclosure regarding executive compensation required of larger public companies or hold stockholder advisory votes on the executive compensation required by the Dodd-Frank Wall Street Reform and Consumer Protection Act (the “Dodd-Frank Act”); or

·

obtain stockholder approval of any golden parachute payments not previously approved.

We will cease to be an emerging growth company upon the earliest of the:

·

last day of the fiscal year in which we have $1.07 billion or more in total annual gross revenues;

·

date on which we become a “large accelerated filer” (the fiscal year-end on which the total market value of our common equity securities held by non-affiliates is $700 million or more as of June 30);

·

date on which we issue more than $1.0 billion of non-convertible debt over a three-year period; or

·

last day of the fiscal year following the fifth anniversary of our initial public offering.

We have elected to take advantage of certain of the reduced disclosure obligations in this report and may elect to take advantage of other reduced reporting requirements in future filings. As a result, the information that we provide to our stockholders may be different than you might receive from other public reporting companies in which you hold equity interests.

In addition, Section 107 of the JOBS Act also provides that an “emerging growth company” can take advantage of the extended transition period provided in Section 7(a)(2)(B) of the Securities Act of 1933, as amended, for complying with new or revised accounting standards. In other words, an “emerging growth company” can delay the adoption of certain accounting standards until those standards would otherwise apply to private companies.

13

Table of Contents

ITEM 1A. RISK FACTORS

Not applicable to smaller reporting companies.

ITEM 1B. UNRESOLVED STAFF COMMENTS

None.

ITEM 2. PROPERTIES

On July 14, 2021, as amended on February 1, 2022, we entered into a lease agreement for the use of our current office space located at 500 7th Avenue, 8th Floor, New York, New York 10018 of approximately 917 square feet for $15,630 per month. Previously, our offices were located at 330 Seventh Avenue, 10th Floor, New York, NY 10001 and consisted of approximately 1,800 square feet of leased office space. The lease for 330 Seventh Avenue, 10th Floor, New York, NY 10001 was supposed to expire on June 1, 2021. The rent under such lease was $9,000 per month based on the use of 15 desks in the office space per month. On June 18, 2020, we entered into that certain Sublease Termination Agreement and terminated the lease for 330 Seventh Avenue, 10th Floor, New York, NY 10001. We believe that our facilities are adequate for our current needs and that suitable additional or substitute space would be available if needed.

ITEM 3. LEGAL PROCEEDINGS

From time to time, we may be subject to various other legal proceedings and claims that are routine and incidental to our business. Although some of the legal proceedings set forth herein may result in adverse decisions or settlements, Management believes that the final disposition of such matters will not have a material adverse effect on our business, financial position, results of operations or cash flows.

In addition, the following material legal proceedings were recently settled:

On October 6, 2017, the Company entered into a Master Service Agreement for Buyers and Sellers, and an “Engage Buyer Addendum”, with Engage BDR, LLC whereby the Company could gain access to the Engage BDR, LLC proprietary trading technology platform in order to both offer and purchase inventory for the placement of ads. On August 31, 2018, Engage BDR, LLC filed suit against the Company (Engage BDR, LLC v. Kubient, Inc., Los Angeles County Superior Court Case No. SC129764) setting forth claims of breach of contract, unjust enrichment, quantum meruit, accounts stated, and breach of implied covenant of good faith and fair dealing. On November 14, 2018, Engage BDR, LLC obtained a summary default judgment against the Company for $35,936. On February 17, 2021, the Company paid a total of $33,461 in full satisfaction of the matter.

On March 11, 2022, the Company, Aureus Holdings, LLC d/b/a Lo70s (“Lo70s”) and JPAR, LLC entered into a Settlement Agreement and Mutual Release (the “Lo70s Settlement Agreement”).  Pursuant to the Lo70s Settlement Agreement, the parties agreed to dismiss the litigation (Aureus Holdings, LLC d/b/a Lo70s v. Kubient, Inc., et al., Superior Court of Delaware, Case No. N20C-07-061) and resolve all claims among them, including potential or future claims arising from the letter of intent that the Company and Lo70s had entered into in March 2019, as well as a consulting agreement entered into between the Company and an employee of Lo70s in connection with such letter of intent. On March 14, 2022, the court in the matter entered an order approving the Lo70s Settlement Agreement, and the case was dismissed with prejudice.  In the Lo70s Settlement Agreement, the Company expressly denies any and all liability and the dismissal of the case with prejudice was entered by the court without a final judgment of liability entered against the Company. Under the terms of the Lo70s Settlement Agreement, the Company made a cash payment of $975,000 to Lo70s in full satisfaction of the matter, as well as the releases and covenants of Lo70s and JPAR, LLC set forth in the agreement, such that the Lo70s Settlement Agreement fully concludes this matter.

ITEM 4. MINE SAFETY DISCLOSURES

Not applicable.

14

Table of Contents

PART II

ITEM 5. MARKET FOR REGISTRANT’S COMMON EQUITY, RELATED STOCKHOLDER MATTERS AND ISSUER PURCHASES OF EQUITY SECURITIES

Market Information

Our common stock is listed on The Nasdaq Capital Market under the symbol “KBNT.” Our common stock purchase warrants are listed on The Nasdaq Capital Market under the symbol “KBNTW.”

Holders of Record

As of March 25, 2022, we had approximately 37 holders of record of our common stock.

Dividends

We have not historically declared dividends on our common stock, and we do not currently intend to pay dividends on our common stock. The declaration, amount and payment of any future dividends on shares of our common stock, if any, will be at the sole discretion of our board of directors, out of funds legally available for dividends. We anticipate that we will retain our earnings, if any, for the growth and development of our business.

Securities Authorized for Issuance Under Equity Compensation Plans

Number of securities

remaining available for

Number of securities

future issuance under

to be issued upon

Weighted-average

equity compensation

exercise of outstanding

exercise price of

plans (excluding

options, warrants and

outstanding options,

securities reflected in


rights


warrants and rights


column (a))

Plan category

(a)

(b)

(c)

Equity compensation plans approved by security holders


94,447

$

11.56


1,411,889

Equity compensation plans not approved by security holders


Total


94,447

$

11.56


1,411,889

The Kubient, Inc. 2017 Equity Incentive Plan was originally adopted by our board of directors and approved by our stockholders on September 12, 2017, and was subsequently amended and restated on June 5, 2019 (the “2017 Plan”). The purposes of the 2017 Plan are to attract and retain the best available personnel for positions of substantial responsibility, to provide additional incentive to our service providers and to promote the success of the Company’s business. We have reserved 333,334 shares of our common stock to issue awards under our 2017 Plan. As of December 31, 2021, there were options to purchase 94,447 shares of our common stock with a weighted average exercise price of $11.56 per share that were outstanding under the 2017 Plan. As of December 31, 2021, a total of 236,073 shares of common stock were issued under the 2017 Plan. Accordingly, as of December 31, 2021, 11,889 shares of common stock remained available for future issuance under the 2017 Plan.

The Kubient, Inc. 2021 Equity Incentive Plan was originally adopted by our board of directors and approved by our stockholders on June 30, 2021 (the “2021 Plan”). The purposes of the 2021 Plan are to attract and retain the best available personnel for positions of substantial responsibility, to provide additional incentive to our service providers and to promote the success of the Company’s business. We have reserved 1,500,000 shares of our common stock to issue awards under our 2021 Plan. As of December 31, 2021, a total of 100,000 shares of common stock were issued under the 2021 Plan. Accordingly, as of December 31, 2021, 1,400,000 shares of common stock remained available for future issuance under the 2021 Plan.

15

Table of Contents

Recent Sales of Unregistered Securities

During the three months ended December 31, 2021, the Company issued 1,062 shares of common stock to a former director.

The foregoing securities were issued in reliance upon an exemption from registration pursuant to Rule 701 promulgated under the Securities Act.

Purchase of Equity Securities by Issuer and Affiliated Purchasers

None.

ITEM 6. [RESERVED]

ITEM 7. MANAGEMENT’S DISCUSSION AND ANALYSIS OF FINANCIAL CONDITION AND RESULTS OF OPERATIONS

The following discussion and analysis of our financial condition and results of operations should be read together with our consolidated financial statements and related notes thereto included elsewhere in this Annual Report. This discussion and analysis contains forward-looking statements that are based upon current expectations and involve risks, assumptions and uncertainties.

Overview

Kubient, a Delaware corporation, was incorporated in May 2017 to solve some of the most significant problems facing the global digital advertising industry.

Our experienced team of marketing and technology veterans has developed the Audience Marketplace, a modular, highly scalable, transparent, cloud-based software platform for real-time trading of digital, Programmatic Advertising. Our platform’s open marketplace gives both advertisers (ad space buyers) and Publishers (ad space sellers) the ability to use machine learning in the most critical parts of any Programmatic Advertising inventory auction, while simultaneously and significantly reducing those advertisers and Publishers’ exposure to fraud, specifically in the Pre-bid environment.

We also provide unique capabilities with our proprietary pre-bid ad fraud detection and prevention, Kubient Artificial Intelligence (“KAI”), which has the ability to stop fraud in the critical 300 millisecond window before an advertiser spends their budget on fraudulent ad space. The technology is powered by deep learning algorithms, the latest advancement in machine learning, which allows us to ingest vast amounts of data, find complex patterns in the data and make accurate predictions. Most importantly, it’s self-learning, getting smarter and more accurate over time. This provides advertisers a powerful tool capable of preventing the purchase of ad fraud.

We believe that our Audience Marketplace technology allows advertisers to reach entire audiences rather than buying single impressions from disparate sources. By becoming a one stop shop for advertisers and publishers, providing them with the technology to deliver meaningful messages to their target audience, all in one place, on a single platform that is computationally efficient, transparent, and as safely fraud-free as possible, we believe that our Audience Marketplace platform (and the application of the platform’s machine learning algorithms) leads to increased publisher revenue, lower advertiser cost, reduced latency and increased economic transparency during the advertising auction process.

16

Table of Contents

Results of Operations

Year Ended December 31, 2021 Compared With Year Ended December 31, 2020


For the Years Ended

December 31, 

2021


2020

Net Revenues

$

2,737,767

$

2,900,029

Costs and Expenses:


Sales and marketing

3,032,133

1,117,375

Technology


3,079,752


2,088,538

General and administrative


6,117,601


4,160,854

Loss on legal settlement

880,381

Total Costs and Expenses


13,109,867


7,366,767

Loss From Operations


(10,372,100)


(4,466,738)

Other (Expense) Income:


Interest expense


(8,383)


(1,135,675)

Interest expense - related parties


(403,372)

Interest income


88,537


25,178

Amortization of beneficial conversion feature


(1,984,322)

Gain on settlement of notes and other payables, net


124,999

Gain on forgiveness of accounts payable - supplier


236,248

Loss on extinguishment of convertible note payable


(297,272)

Other income


233


15,294

Total Other Income (Expense)


80,387


(3,418,922)

Net Loss


(10,291,713)


(7,885,660)

Deemed dividend related to warrant down round adjustment


(1,682,000)

Net Loss Attributable to Common Shareholders

$

(10,291,713)

$

(9,567,660)

17

Table of Contents

Net Revenues

For the year ended December 31, 2021, net revenues decreased by $162,262, or 6%, to $2,737,767 from $2,900,029 for the year ended December 31, 2020. The decrease was primarily due to approximately $1,300,000 of revenue generated in connection with beta testing of KAI, our fraud detection service, which commenced during the 2020 period, as well as approximately $1,496,000 of net revenue generated from one new customer in the 2020 period, as compared to approximately $2,348,000 of revenue generated from the same customer in the 2021 period.

Sales and Marketing

For the year ended December 31, 2021, sales and marketing expenses increased by $1,914,758, or 171%, to $3,032,133 from $1,117,375 for the year ended December 31, 2020. The increase is primarily a result of the expansion of our sales and marketing department which resulted in increases in salary expense of approximately $1,194,000 arising from an increase in sales and marketing personnel headcount, as well as increased stock-based compensation of approximately $270,000, consulting fees of approximately $195,000 and selling expense of approximately $164,000.

Technology

For the year ended December 31, 2021, technology expenses increased by $991,214, or 47%, to $3,079,752 from $2,088,538 for the year ended December 31, 2020. The increase is primarily due to increases in salary expense of approximately $207,000 arising from an increase in technology personnel headcount, as well as increased stock-based compensation of approximately $18,000, consulting expenses of approximately $39,000, amortization of software of approximately $124,000 and cloud hosting costs of approximately $310,000.

General and Administrative

For the year ended December 31, 2021, general and administrative expenses increased by $1,956,747, or 47%, to $6,117,601 from $4,160,854 for the year ended December 31, 2020. The increase from 2020 to 2021 is primarily due to increases in legal fees of approximately $979,000, recruiting fees of approximately $275,000 arising from an increase in headcount, insurance expense of approximately $322,000, and state franchise taxes of approximately $160,000.

Loss on Legal Settlement

The Company recognized a loss on legal settlement of $880,381 for the year ended December 31, 2021 related to a settlement agreement reached in March 2022 wherein we made a cash payment of $975,000 to Lo70s in consideration of the dismissal of the ligation among the parties, as well as the releases and covenants of the parties.

Other Income (Expense)

For the year ended December 31, 2021, the Company had other income of $80,387 as compared to other expense of $(3,418,922) during the year ended December 31, 2020. The net decrease in other expense is primarily due to the absence of the amortization of beneficial conversion feature of approximately $1,984,000 and interest expense of approximately $1,539,000 that were recognized in the 2020 period, as these items no longer continued after the notes payable were converted at the closing of the initial public offering in August 2020 which resulted in net proceeds of approximately $10.6 million (“IPO”).

Non-GAAP Measures

Adjusted EBITDA

The Company defines EBITDA as net income (loss) before interest, taxes and depreciation and amortization. The Company defines Adjusted EBITDA as EBITDA, further adjusted to eliminate the impact of certain non-recurring items and other items that we do not consider in our evaluation of our ongoing operating performance from period to period. These items will include stock-based compensation, restructuring and severance costs, transaction costs, acquisition costs, certain other non-recurring charges and gains that the Company does not believe reflects the underlying business performance.

18

Table of Contents

For the years ended December 31, 2021 and 2020, EBITDA and Adjusted EBITDA consisted of the following:


For the Years Ended 

December 31, 


2021


2020

Net Loss Attributable to Common Shareholders

$

(10,291,713)

$

(9,567,660)

Interest expense


8,383


1,135,675

Interest expense - related parties


403,372

Interest income


(88,537)


(25,178)

Depreciation and amortization


452,136


315,202

Amortization of beneficial conversion feature


1,984,322

EBITDA


(9,919,731)


(5,754,267)

Adjustments:


Deemed dividend related to warrant down round adjustment


1,682,000

Stock-based compensation expense


724,042


468,216

Adjusted EBITDA

$

(9,195,689)

$

(3,604,051)

Adjusted Loss Per Share

$

(0.67)

$

(0.70)

Weighted Average Common Shares Outstanding -


Basic and Diluted


13,695,700


5,185,204

EBITDA and Adjusted EBITDA is a financial measure that is not calculated in accordance with accounting principles generally accepted in the United States of America (“U.S. GAAP”). Management believes that because Adjusted EBITDA excludes (a) certain non-cash expenses (such as depreciation, amortization and stock-based compensation) and (b) expenses that are not reflective of the Company’s core operating results over time (such as stock-based compensation expense), this measure provides investors with additional useful information to measure the Company’s financial performance, particularly with respect to changes in performance from period to period. The Company’s management uses EBITDA and Adjusted EBITDA (a) as a measure of operating performance, (b) for planning and forecasting in future periods, and (c) in communications with the Company’s board of directors concerning the Company’s financial performance. The Company’s presentation of EBITDA and Adjusted EBITDA are not necessarily comparable to other similarly titled captions of other companies due to different methods of calculation and should not be used by investors as a substitute or alternative to net income or any measure of financial performance calculated and presented in accordance with U.S. GAAP. Instead, management believes EBITDA and Adjusted EBITDA should be used to supplement the Company’s financial measures derived in accordance with U.S. GAAP to provide a more complete understanding of the trends affecting the business.

Although Adjusted EBITDA is frequently used by investors and securities analysts in their evaluations of companies, Adjusted EBITDA has limitations as an analytical tool, and investors should not consider it in isolation or as a substitute for, or more meaningful than, amounts determined in accordance with U.S. GAAP. Some of the limitations to using non-GAAP measures as an analytical tool are (a) they do not reflect the Company’s interest income and expense, or the requirements necessary to service interest or principal payments on the Company’s debt, (b) they do not reflect future requirements for capital expenditures or contractual commitments, and (c) although depreciation and amortization charges are non-cash charges, the assets being depreciated and amortized will often have to be replaced in the future, and non-GAAP measures do not reflect any cash requirements for such replacements.

Liquidity and Capital Resources

We measure our liquidity in a number of ways, including the following:


December 31,

2021


2020

Cash and cash equivalents

$

24,907,963

$

24,782,128

Working capital

$

22,676,301

$

23,570,158

19

Table of Contents

Availability of Additional Funds

As a result of its public offerings and the related note conversions, we believe our current cash on hand is sufficient to meet its operating and capital requirements for at least the next twelve months from the date these financial statements are issued. Our operating needs include the planned costs to operate our business, including amounts required to fund working capital and capital expenditures. Our future capital requirements and the adequacy of our available funds will depend on many factors, including our ability to successfully commercialize our products and services, competing technological and market developments, and the need to enter into collaborations with other companies or acquire other companies or technologies to enhance or complement our product and service offerings.

Cash Flows

Year Ended December 31, 2021 Compared With Year Ended December 31, 2020

Our sources and uses of cash were as follows:

Cash Flows From Operating Activities

We experienced negative cash flows from operating activities for the years ended December 31, 2021 and 2020 in the amounts of $7,674,792 and $4,805,116, respectively. The net cash used in operating activities for the year ended December 31, 2021 was primarily a result of cash used to fund a net loss of $10,291,713, adjusted for net non-cash expenses of $1,198,876, partially offset by $1,418,045 of net cash provided by changes in the levels of operating assets and liabilities. The net cash used in operating activities for the year ended December 31, 2020 was primarily a result of cash used to fund a net loss of $7,885,660, adjusted for net non-cash expenses of $3,984,553, and $904,009 of net cash used in changes in the levels of operating assets and liabilities.

Cash Flows From Investing Activities

Net cash used in investing activities for the year ended December 31, 2021 was $1,672,486, which was attributable to aggregate purchases of intangible assets, property and equipment of $1,133,072 and $500,000 used in connection with the MediaCrossing purchase consideration. Net cash used in investing activities for the year ended December 31, 2020 was $1,316,336, which was attributable to aggregate purchases of intangible assets, property and equipment.

Cash Flows From Financing Activities

We experienced positive cash flows from financing activities for the years ended December 31, 2021 and 2020 in the amounts of $9,473,113 and $30,869,795, respectively. During the year ended December 31, 2021, $9,787,149 of proceeds were from exercises of options and warrants, partially offset by $145,050 of cash used to repay financed director and officer insurance premiums and $177,347 was used to partially repay our loan from JPMorgan Chase Bank, N.A., as lender, pursuant to the Paycheck Protection Program of the Coronavirus Aid, Relief and Economic Security Act, as amended. During the year ended December 31, 2020, $30,732,981 of proceeds were from the sale of common stock and warrants in our IPO and follow-on public offering, $1,241,190 of proceeds were received from debt financings, and $11,000 of proceeds were received from the exercise of warrant, partially offset by $841,376 used for payment of initial public offering costs and $274,000 that was used to repay debt.

Off-Balance Sheet Arrangements

We did not have, during the periods presented, and we do not currently have, any relationships with any organizations or financial partnerships, such as structured finance or special purpose entities, that would have been established for the purpose of facilitating off-balance sheet arrangements or other contractually narrow or limited purposes.

Contractual Obligations

As a smaller reporting company, we are not required to provide the information required by paragraph (a)(5) of this Item.

20

Table of Contents

Critical Accounting Estimates

The preparation of financial statements in conformity with accounting principles generally accepted in the United States of America, or U.S. GAAP, requires management to make estimates and assumptions that affect the reported amounts of assets and liabilities, contingent assets and liabilities, each as of the date of the financial statements, and revenues and expenses during the periods presented. On an ongoing basis, management evaluates their estimates and assumptions, and the effects of any such revisions are reflected in the financial statements in the period in which they are determined to be necessary. Management bases their estimates on historical experience and on various other factors that they believe are reasonable under the circumstances, the results of which form the basis for making judgments about the carrying value of assets and liabilities that are not readily apparent from other sources. Actual outcomes could differ materially from those estimates in a manner that could have a material effect on our consolidated financial statements. While our significant accounting policies are more fully described in the notes to our consolidated financial statements appearing elsewhere in this prospectus, we believe that the following accounting policies and estimates are critical to the process of making significant judgments and estimates in the preparation of our financial statements and understanding and evaluating our reported financial results.

Revenue Recognition

The Company maintains a contract with each customer and supplier, which specify the terms of the relationship. The Company provides a service to its customers (the buy-side ad networks who work for advertisers) by connecting advertisers and publishers. For this service, the Company earns a percentage of the amount that is paid by the advertiser, who wants to run a digital advertising campaign, which, in some cases, is reduced by the amount paid to the publisher, who wants to sell its ad space to the advertiser.

The transaction price is determined based on the consideration to which it expects to be entitled, including the impact of any implicit price concessions over the course of the contract. The Company’s performance obligation is to facilitate the publication of advertisements. The performance obligation is satisfied at the point in time that the ad is placed. Subsequent to a bid being won, the associated fees are generally not subject to refund or adjustment. Historically, any refunds and adjustments have not been material. The revenue recognized is the amount the Company is responsible to collect from the customer related to the placement of an ad (the “Gross Billing”), less the amount the Company remits to the supplier for the ad space (the “Supplier Cost”), if any. The determination of whether the Company is the principal or agent, and hence whether to report revenue on a gross basis equal to the Gross Billing or on a net basis for the difference between the Gross Billing and Supplier Cost, requires judgment. The Company acts as an agent in arranging via its platform for the specified good (the ad space) to be purchased by the advertiser, as it does not control the goods or services being transferred to the end customer, it does not take responsibility for the quality or acceptability of the ad space, it does not bear inventory risk, nor does it have discretion in establishing price of the ad space. As a result, the Company recognizes revenue on a net basis for the difference between the Gross Billing and the Supplier Cost.

The Company invoices customers on a monthly basis for the amount of Gross Billings in the relevant period. Invoice payment terms, negotiated on a customer-by- customer basis, are typically between 45 to 90 days. However, for certain agency customers with sequential liability terms as specified by the Interactive Advertising Bureau, (i) payments are not due to the Company until such agency customers has received payment from its customers (ii) the Company is not required to make a payment to its supplier until payment is received from the Company’s customer and (iii) the supplier is responsible to pursue collection directly with the advertiser. As a result, once the Company has met the requirements of each of the five steps under ASC 606, the Company’s accounts receivable are recorded at the amount of Gross Billings which represent amounts it is responsible to collect and accounts payable, if applicable, are recorded at the amount payable to suppliers. In the event step 1 under ASC 606 is not met, the Company does not record either the accounts receivable or accounts payable. Accordingly, both accounts receivable and accounts payable appear large in relation to revenue reported on a net basis.

21

Table of Contents

Business Combinations

Business combinations are accounted for using the acquisition method and, accordingly, the assets acquired (including identified intangible assets), the liabilities assumed and any contingent consideration are recorded at their acquisition date fair values. The Company’s fair value measurement of the contingent consideration is based on significant inputs not observed in the market and thus represents a Level 3 measurement. Level 3 instruments are valued based on unobservable inputs that are supported by little or no market activity and reflect the Company’s own assumptions in measuring fair value.

Intangible Assets

Intangible assets are comprised of costs to acquire and develop computer software, including the costs to acquire third-party data which is used to improve the Company’s artificial intelligence platform for client use, as well as costs to acquire customer lists, customer contracts and related customer relationship and restrictive covenant agreements. The intangible assets have estimated useful lives of two years for the computer software, five years for the capitalized data, seven years for the customer lists and three years for the restrictive covenant agreements. Once placed into service, the Company amortizes the cost of the intangible assets over their estimated useful lives on a straight-line basis.

Impairment of Long-lived Assets

The Company reviews for the impairment of long-lived assets whenever events or changes in circumstances indicate that the carrying amount of an asset might not be recoverable. An impairment would be recognized when estimated future cash flows expected to result from the use of the asset and its eventual disposition are less than its carrying amount.

Stock-Based Compensation

The Company measures the cost of services received in exchange for an award of equity instruments based on the fair value of the award. The fair value of the award is measured on the grant date. The fair value amount is then recognized over the period during which services are required to be provided in exchange for the award, usually the vesting period. Upon the exercise of an award, the Company issues new shares of common stock out of its authorized shares. The Company accrues for any equity awards at fair value that have been contractually earned but not yet issued.

ITEM 7A. QUANTITATIVE AND QUALITATIVE DISCLOSURES ABOUT MARKET RISK

Not required for smaller reporting companies.

22

Table of Contents

ITEM 8. FINANCIAL STATEMENTS AND SUPPLEMENTARY DATA


Page

Report of Independent Registered Public Accounting Firm (PCAOB ID: 688)

F-1


Consolidated Balance Sheets as of December 31, 2021 and 2020

F-2


Consolidated Statements of Operations for the Years Ended December 31, 2021 and 2020

F-3


Consolidated Statements of Changes in Stockholders’ Equity (Deficiency) for the Years Ended December 31, 2021 and 2020

F-4


Consolidated Statements of Cash Flows for the Years Ended December 31, 2021 and 2020

F-5


Notes to Consolidated Financial Statements

F-7

23

Table of Contents

REPORT OF INDEPENDENT REGISTERED PUBLIC ACCOUNTING FIRM

To the Stockholders and Board of Directors of

Kubient, Inc.

Opinion on the Financial Statements

We have audited the accompanying consolidated balance sheets of Kubient, Inc. (the “Company”) as of December 31, 2021 and 2020, the related consolidated statements of operations, stockholders’ equity (deficiency) and cash flows for each of the two years in the period ended December 31, 2021, and the related notes (collectively referred to as the “financial statements”).  In our opinion, the financial statements present fairly, in all material respects, the financial position of the Company as of December 31, 2021 and 2020, and the results of its operations and its cash flows for each of the two years in the period ended December 31, 2021, in conformity with accounting principles generally accepted in the United States of America.

Basis for Opinion

These financial statements are the responsibility of the Company's management. Our responsibility is to express an opinion on the Company's financial statements based on our audits. We are a public accounting firm registered with the Public Company Accounting Oversight Board (United States) ("PCAOB") and are required to be independent with respect to the Company in accordance with the U.S. federal securities laws and the applicable rules and regulations of the Securities and Exchange Commission and the PCAOB.

We conducted our audits in accordance with the standards of the PCAOB. Those standards require that we plan and perform the audits to obtain reasonable assurance about whether the financial statements are free of material misstatement, whether due to error or fraud. The Company is not required to have, nor were we engaged to perform, an audit of its internal control over financial reporting. As part of our audits we are required to obtain an understanding of internal control over financial reporting but not for the purpose of expressing an opinion on the effectiveness of the Company's internal control over financial reporting. Accordingly, we express no such opinion.

Our audits included performing procedures to assess the risks of material misstatement of the financial statements, whether due to error or fraud, and performing procedures that respond to those risks. Such procedures included examining, on a test basis, evidence regarding the amounts and disclosures in the financial statements. Our audits also included evaluating the accounting principles used and significant estimates made by management, as well as evaluating the overall presentation of the financial statements. We believe that our audits provide a reasonable basis for our opinion.

/s/ Marcum LLP

Marcum LLP

We have served as the Company’s auditor since 2019.

Los Angeles, CA

March 30, 2022

F-1

Table of Contents

Kubient, Inc.

Consolidated Balance Sheets

December 31, 


2021


2020

Assets


Current Assets:


Cash and cash equivalents

$

24,907,963

$

24,782,128

Accounts receivable, net


2,291,533


1,373,754

Other receivables

526,070

Prepaid expenses and other current assets


495,178


107,651

Total Current Assets


28,220,744


26,263,533

Intangible assets, net


2,946,610


1,071,850

Goodwill

463,000

Property and equipment, net


44,756


17,166

Deferred offering costs


10,000


10,000

Total Assets

$

31,685,110

$

27,362,549

Liabilities and Stockholders’ Equity


Current Liabilities:


Accounts payable - suppliers

$

1,844,544

$

336,028

Accounts payable - trade


659,362


1,106,604

Accrued expenses and other current liabilities


2,493,287


1,017,282

Deferred revenue

395,914

15,000

Notes payable


151,336


218,461

Total Current Liabilities


5,544,443


2,693,375

Contingent consideration

613,000

Notes payable, non-current portion


77,407


187,629

Total Liabilities


6,234,850


2,881,004

Commitments and contingencies (Note 9)


Stockholders’ Equity:


Preferred stock, $0.00001 par value; 5,000,000 shares authorized; No shares issued and outstanding as of December 31, 2021 and 2020


Common stock, $0.00001 par value; 95,000,000 shares authorized; 14,253,948 and 11,756,109 shares issued and outstanding as of December 31, 2021 and 2020 respectively


143


118

Additional paid-in capital


52,030,907


40,770,504

Accumulated deficit


(26,580,790)


(16,289,077)

Total Stockholders’ Equity


25,450,260


24,481,545

Total Liabilities and Stockholders’ Equity

$

31,685,110

$

27,362,549

The accompanying notes are an integral part of these consolidated financial statements.

F-2

Table of Contents

Kubient, Inc.

Consolidated Statements of Operations

For the Years Ended

December 31, 


2021


2020

Net Revenues

$

2,737,767

$

2,900,029

Costs and Expenses:


Sales and marketing

3,032,133

1,117,375

Technology


3,079,752


2,088,538

General and administrative


6,117,601


4,160,854

Loss on legal settlement

880,381

Total Costs and Expenses


13,109,867


7,366,767

Loss From Operations


(10,372,100)


(4,466,738)

Other (Expense) Income:


Interest expense


(8,383)


(1,135,675)

Interest expense - related parties


(403,372)

Interest income

88,537

25,178

Amortization of beneficial conversion feature


(1,984,322)

Gain on settlement of notes and other payables, net


124,999

Gain on forgiveness of accounts payable - supplier


236,248

Loss on extinguishment of convertible note payable


(297,272)

Other income


233


15,294

Total Other Income (Expense)


80,387


(3,418,922)

Net Loss


(10,291,713)


(7,885,660)

Deemed dividend related to warrant down round adjustment


(1,682,000)

Net Loss Attributable to Common Shareholders

$

(10,291,713)

$

(9,567,660)

Net Loss Per Share - Basic and Diluted

$

(0.75)

$

(1.85)

Weighted Average Common Shares Outstanding - Basic and Diluted


13,695,700


5,185,204

The accompanying notes are an integral part of these consolidated financial statements.

F-3

Table of Contents

Kubient, Inc.

Consolidated Statements of Changes in Stockholders’ Equity (Deficiency)

For the Years Ended December 31, 2021 and 2020


Additional

Common Stock

Paid-In

Accumulated


Shares


Amount


Capital


Deficit


Total

Balance - January 1, 2020


3,601,521

$

36

$

3,362,724

$

(8,403,417)

$

(5,040,657)

Issuance of common stock and warrants in initial public offering, net of issuance costs [1]


2,500,000


25


10,605,720


10,605,745

Conversion of notes payable and accrued interest into common stock and warrants

1,461,090

15

7,304,815

7,304,830

Conversion of notes payable and accrued interest into common stock


94,223


1


388,143


388,144

Issuance of common stock and warrants in follow-on public offering, net of issuance costs [2]

4,058,822

41

18,889,872

18,889,913


Stock-based compensation:


Common stock


38,433


154,922


154,922

Options


19,570


19,570

Forgiveness of accrued expenses by related party


33,738


33,738

Exercise of warrant


2,000


11,000


11,000

Effect of reverse stock-split


20

Net loss

(7,885,660)

(7,885,660)

Balance - December 31, 2020

11,756,109

118

40,770,504

(16,289,077)

24,481,545

Shares issued upon exercise of warrants, net of issuance costs [3]

2,156,322

21

9,703,609

9,703,630

Common stock issued upon exercise of options

2,815

8,361

8,361

Shares issued as partial consideration for intangible asset

100,000

1

531,999

532,000

Stock-based compensation:

Common stock

238,702

3

993,044

993,047

Options

23,390

23,390

Net loss

(10,291,713)

(10,291,713)

Balance - December 31, 2021

14,253,948

$

143

$

52,030,907

$

(26,580,790)

$

25,450,260

[1] Includes gross proceeds of $12,503,750, less issuance costs of $1,898,005.

[2] Includes gross proceeds of $20,699,992, less issuance costs of $1,810,080.

[3] Includes gross proceeds of $10,169,027, less issuance costs of $465,397.

The accompanying notes are an integral part of these consolidated financial statements.

F-4

Table of Contents

Kubient, Inc.

Consolidated Statements of Cash Flows


For the Years Ended

December 31, 


2021


2020

Cash Flows From Operating Activities:


Net loss

$

(10,291,713)

$

(7,885,660)

Adjustments to reconcile net loss to net cash used in operating activities:


Depreciation and amortization


452,136


315,202

Bad debt expense


22,698


7,593

Gain on forgiveness of accounts payable - supplier


(236,248)

Stock-based compensation:


Common stock


700,652


448,646

Options


23,390


19,570

Amortization of debt discount and debt issuance costs


915,994

Amortization of debt discount and debt issuance costs - related parties


357,201

Amortization of beneficial conversion feature


1,984,322

Loss on extinguishment of convertible note payable

297,272

Loss on settlement of other payables


23,601

Gain on settlement of notes and other payables


(148,600)

Changes in operating assets and liabilities:


Accounts receivable


(940,477)


(1,342,643)

Other receivable


3,955


Prepaid expenses and other current assets


73,491


(79,579)

Accounts payable - suppliers


1,508,516


(191,125)

Accounts payable - trade


(447,242)


211,922

Accrued expenses and other current liabilities


1,467,306


497,416

Deferred revenue


(247,504)


Net Cash Used In Operating Activities


(7,674,792)


(4,805,116)

Cash Flows From Investing Activities:


Purchase of intangible assets


(1,133,072)


(1,300,336)

Purchase consideration of MediaCrossing


(500,000)


Purchase of property and equipment


(39,414)


(16,000)

Net Cash Used In Investing Activities

(1,672,486)

(1,316,336)


Cash Flows From Financing Activities:

Proceeds from exercise of warrants [1]


9,787,149


Repayment of PPP loan


(177,347)


Repayment of financed director and officer insurance premiums


(145,050)


Proceeds from exercise of options

8,361

Proceeds from sale of common stock and warrants in initial public offering, net [2]


11,503,488

Payment of initial public offering issuance costs


(841,376)

Proceeds from sale of common stock and warrants in follow-on public offering, net [3]


19,354,493

Payment of follow-on public offering issuance costs


(125,000)

Proceeds from exercise of warrant


11,000

Repayment of advance from related party


(29,000)

Proceeds from issuance of notes payable


406,190

Repayment of notes payable


(95,000)

Proceeds from issuance of notes payable - related parties


835,000

Repayment of note payable - related party


(150,000)

Net Cash Provided By Financing Activities


9,473,113


30,869,795

Net Increase In Cash and Cash Equivalents


125,835


24,748,343

Cash and Cash Equivalents - Beginning of the Year


24,782,128


33,785

Cash and Cash Equivalents - End of the Year

$

24,907,963

$

24,782,128

[1] Includes gross proceeds of $10,169,027, less issuance costs of $381,878.

[2] Includes gross proceeds of $12,503,750, less underwriting discounts and commissions of $1,000,262.

[3] Includes gross proceeds of $20,699,992, less underwriting discounts and commissions of $1,470,499.

The accompanying notes are an integral part of these consolidated financial statements.

F-5

Table of Contents

Kubient, Inc.

Consolidated Statements of Cash Flows (Continued)


For the Years Ended

December 31, 


2021


2020

Supplemental Disclosures of Cash Flow Information:


Cash paid during the year for:


Interest

$

7,912

$

574

Income taxes

$

$

Non-cash investing and financing activities:


Accrual of warrant exercise issuance costs

$

83,519

$

Shares issued as partial consideration for intangible asset

$

532,000

$

Shares of common stock issued in satisfaction of accrued issuable equity

$

507,044

$

Contingent consideration

$

613,000

$

Financing of insurance premiums

$

362,625

$

Conversion of notes payable and accrued interest into common stock

$

$

5,411,381

Original issue discount in connection with convertible notes payable

$

$

285,000

Original issue discount in connection with convertible notes payable - related party

$

$

75,500

Accrual of follow-on offering deferred offering costs

$

$

(339,581)

Reduction of additional paid-in capital for initial public offering issuance costs that were previously paid

$

$

56,367

Reversal of previously accrued deferred offering costs

$

$

218,829

Forgiveness of related party liability

$

$

33,738

The accompanying notes are an integral part of these consolidated financial statements.

F-6

Table of Contents

Kubient, Inc.

Notes to Consolidated Financial Statements

For the Years Ended December 31, 2021 and 2020

NOTE 1 – BUSINESS ORGANIZATION, NATURE OF OPERATIONS, RISKS AND UNCERTAINTIES

Organization and Operations

Kubient, Inc. (“Kubient”, “we”, “our” or the “Company”), a Delaware corporation, was incorporated in May 2017 to solve some of the most significant problems facing the global digital advertising industry.

The Company’s experienced team of marketing and technology veterans has developed the Audience Marketplace, a modular, highly scalable, transparent, cloud-based software platform for real-time trading of digital, Programmatic Advertising. The Company’s platform’s open marketplace gives both advertisers (ad space buyers) and Publishers (ad space sellers) the ability to use machine learning in the most critical parts of any Programmatic Advertising inventory auction, while simultaneously and significantly reducing those advertisers and Publishers’ exposure to fraud, specifically in the Pre-bid environment.

The Company also provides unique capabilities with its proprietary pre-bid ad fraud detection and prevention, Kubient Artificial Intelligence (“KAI”), which has the ability to stop fraud in the critical 300 millisecond window before an advertiser spends their budget on fraudulent ad space. The technology is powered by deep learning algorithms, the latest advancement in machine learning, which allows the Company to ingest vast amounts of data, find complex patterns in the data and make accurate predictions. This provides advertisers a powerful tool capable of preventing the purchase of ad fraud.

The Company believes that its Audience Marketplace technology allows advertisers to reach entire audiences rather than buying single impressions from disparate sources.  By becoming a one stop shop for advertisers and publishers, providing them with the technology to deliver meaningful messages to their target audience, all in one place, on a single platform that is computationally efficient, transparent, and as safely fraud-free as possible, the Company believes that its Audience Marketplace platform (and the application of the platform’s machine learning algorithms) leads to increased publisher revenue, lower advertiser cost, reduced latency and increased economic transparency during the advertising auction process.

Risks and Uncertainties

The novel coronavirus (“COVID-19”) pandemic continues to impact global economic conditions, as well as the Company’s operations. COVID-19 had a meaningful negative impact on our financial condition, cash flows and results of operations during 2020, as revenues declined and we reduced spending in light of COVID-19 uncertainty. Although we continued to experience disruption and volatility during 2021, which could continue to have an adverse effect on our revenues and earnings in 2022, the ultimate economic impact of the pandemic remains fluid, as there continue to be periods of COVID-19 resurgence in various parts of the world. The extent of the impact of the COVID-19 pandemic in 2022 on our operational and financial performance will depend on a variety of factors, some of which are outside our control, including the duration and spread of COVID-19 and its variants, and its impact on our clients, partners, industry, and employees, all of which are uncertain at this time and cannot be accurately predicted.

Similarly, the economic uncertainty caused by the COVID-19 pandemic has made and may continue to make it difficult for us to forecast revenue and operating results and to make decisions regarding operational cost structures and investments. We have committed, and we plan to continue to commit, resources to grow our business, employee base, and technology development, and such investments may not yield anticipated returns, particularly if worldwide business activity continues to be impacted by the COVID-19 pandemic. The duration and extent of the impact from the COVID-19 pandemic depend on future developments that cannot be accurately predicted at this time, and if we are not able to respond to and manage the impact of such events effectively, our business may be harmed.

There can be no assurance that precautionary measures, whether adopted by us or imposed by others, will be effective, and such measures could negatively affect our sales, marketing, and client service efforts, delay and lengthen our sales cycles, decrease our employees’, clients’, or partners’ productivity, or create operational or other challenges, any of which could harm our business and results of operations.

F-7

Table of Contents

Kubient, Inc.

Notes to Consolidated Financial Statements

For the Years Ended December 31, 2021 and 2020

NOTE 2 – SIGNIFICANT ACCOUNTING POLICIES

Basis of Presentation

The accompanying audited consolidated financial statements have been prepared in accordance with accounting principles generally accepted in the United States of America (“U.S. GAAP”). The summary of significant accounting policies presented below is designed to assist in understanding the Company’s consolidated financial statements. Such consolidated financial statements and accompanying notes are the representations of Company’s management, who is responsible for their integrity and objectivity.

Use of Estimates

The preparation of financial statements in conformity with U.S. GAAP requires management to make estimates, judgments, and assumptions that affect the reported amounts of assets and liabilities and disclosure of contingent assets and liabilities at the date of the financial statements and the reported amounts of revenues and expenses during the reporting period. The Company’s significant estimates used in these financial statements include, but are not limited to, fair value calculations for equity securities, revenue recognition, stock-based compensation,the valuation of intangible assets and contingent consideration, useful lives of intangibles assets, the collectability of receivables and the valuation allowance related to the Company’s deferred tax assets. Certain of the Company’s estimates could be affected by external conditions, including those unique to the Company and general economic conditions. It is reasonably possible that these external factors could have an effect on the Company’s estimates and may cause actual results to differ from those estimates.

Principles of Consolidation

The consolidated financial statements of the Company include the accounts of Fidelity Media, LLC (“Fidelity”). All intercompany transactions have been eliminated in the consolidation.

Cash and Cash Equivalents

The Company maintains cash in bank accounts, which, at times, may exceed Federal Deposit Insurance Corporation (“FDIC”) insured limits. The Company has not experienced any losses in such accounts. The Company considers all highly liquid investments with an original maturity of three months or less when purchased to be cash equivalents. As of December 31, 2021 and 2020, the Company’s cash and cash equivalents were comprised of demand deposits held in bank accounts.  

Revenue Recognition

The Company recognizes revenue under Accounting Standards Codification (“ASC”) 606, “Revenue from Contracts with Customers” (“ASC 606”). The Company determines revenue recognition through the following steps:

Identification of a contract with a customer;
Identification of the performance obligations in the contract;
Determination of the transaction price;
Allocation of the transaction price to the performance obligations in the contract; and
Recognition of revenue when or as the performance obligations are satisfied.

F-8

Table of Contents

Kubient, Inc.

Notes to Consolidated Financial Statements

For the Years Ended December 31, 2021 and 2020

The Company maintains a contract with each customer and supplier, which specify the terms of the relationship. The Company provides a service to its customers (the buy-side ad networks who work for advertisers) by connecting advertisers and publishers. For this service, the Company earns a percentage of the amount that is paid by the advertiser, who wants to run a digital advertising campaign, which, in some cases, is reduced by the amount paid to the publisher, who wants to sell its ad space to the advertiser.

The transaction price is determined based on the consideration to which it expects to be entitled, including the impact of any implicit price concessions over the course of the contract. The Company’s performance obligation is to facilitate the publication of advertisements. The performance obligation is satisfied at the point in time that the ad is placed. Subsequent to a bid being won, the associated fees are generally not subject to refund or adjustment. Historically, any refunds and adjustments have not been material. The revenue recognized is the amount the Company is responsible to collect from the customer related to the placement of an ad (the “Gross Billing”), less the amount the Company remits to the supplier for the ad space (the “Supplier Cost”), if any. The determination of whether the Company is the principal or agent, and hence whether to report revenue on a gross basis equal to the Gross Billing or on a net basis for the difference between the Gross Billing and Supplier Cost, requires judgment. The Company acts as an agent in arranging via its platform for the specified good (the ad space) to be purchased by the advertiser, as it does not control the goods or services being transferred to the end customer, it does not take responsibility for the quality or acceptability of the ad space, it does not bear inventory risk, nor does it have discretion in establishing price of the ad space. As a result, the Company recognizes revenue on a net basis for the difference between the Gross Billing and the Supplier Cost.

The Company invoices customers on a monthly basis for the amount of Gross Billings in the relevant period. Invoice payment terms, negotiated on a customer-by- customer basis, are typically between 45 to 90 days. However, for certain agency customers with sequential liability terms as specified by the Interactive Advertising Bureau, (i) payments are not due to the Company until such agency customers has received payment from its customers (ii) the Company is not required to make a payment to its supplier until payment is received from the Company’s customer and (iii) the supplier is responsible to pursue collection directly with the advertiser. As a result, once the Company has met the requirements of each of the five steps under ASC 606, the Company’s accounts receivable are recorded at the amount of Gross Billings which represent amounts it is responsible to collect and accounts payable, if applicable, are recorded at the amount payable to suppliers. In the event step 1 under ASC 606 is not met, the Company does not record either the accounts receivable or accounts payable. Accordingly, both accounts receivable and accounts payable appear large in relation to revenue reported on a net basis.

As of December 31, 2021 and 2020, the Company did not have any contract assets from contracts with customers. As of December 31, 2021 and 2020, the Company had $395,914 and $15,000, respectively, of contract liabilities where performance obligations have not yet been satisfied. The Company expects to satisfy its remaining performance obligations and recognize the revenue within the next twelve months. During the years ended December 31, 2021 and 2020, there was no revenue was recognized from performance obligations satisfied (or partially satisfied) in previous periods.

Accounts Receivable and Accounts Payable

Accounts receivable are carried at their contractual amounts, less an estimate for uncollectible amounts. As of December 31, 2021 and 2020, there was an allowance for uncollectible amounts of $12,149 and $